3:30 p.m. New York time
Half an hour before the closing bell. The S&P 500 fell slightly during the day, a movement that, under my principal analysis, is the 3rd leg of a low-level correction. No change to the analysis. Chart updated.
9:35 a.m. New York time
What’s happening now? The S&P 500 E-mini futures completed the first leg of a downward correction of the rise that began August 4, and the subsequent small rise completed the second leg, which moves opposite the trend of the correction.
What does it mean? The shallow correction will be followed by a renewal of the uptrend that began on July 19 that will bring the price to new highs.
What’s the alternative? The fall and reversal from the August 16 high may be a first leg within the first leg of the correction. I.e., it may be one level smaller than my principle analysis shows. This has no impact on the larger analysis of more upside ahead.
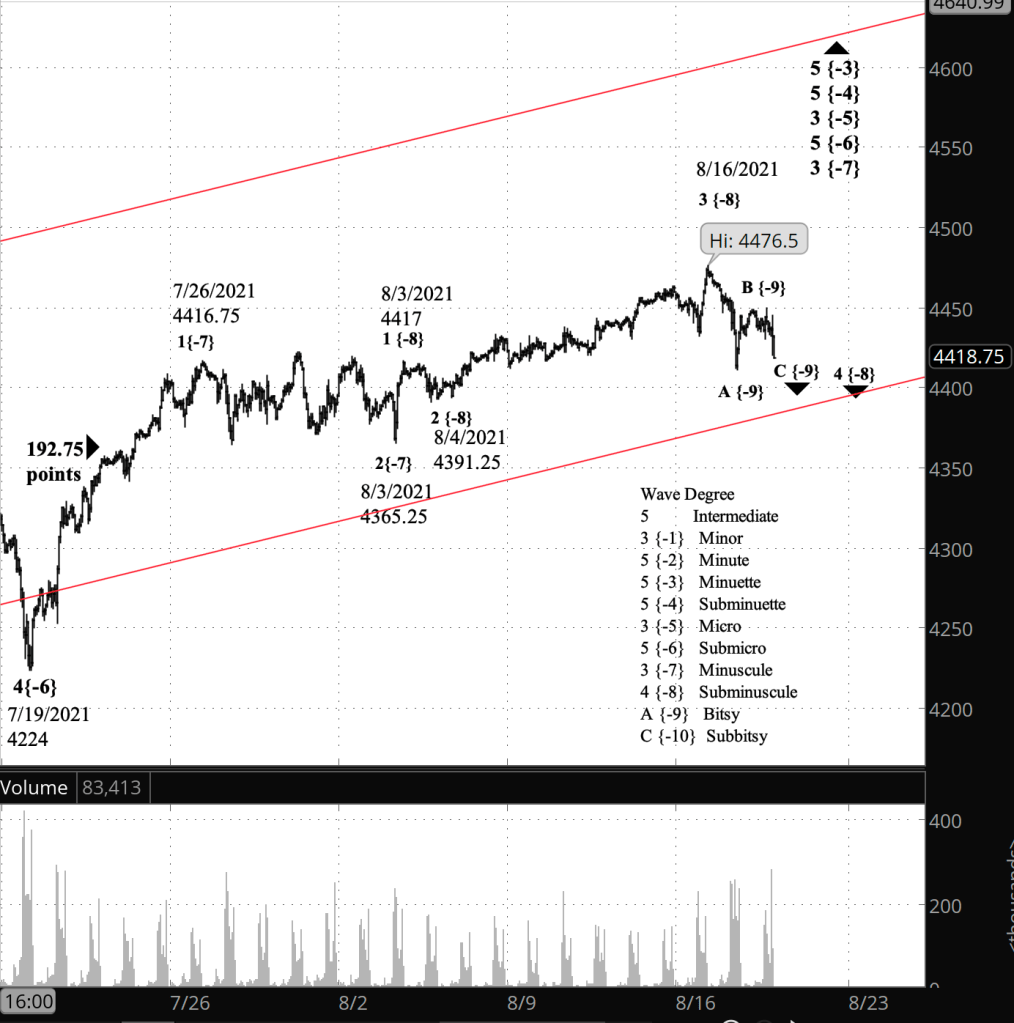
What does Elliott wave theory say? By my principal analysis, the high of August 16 ended wave 3 of Subminuscule degree and marked the start of Subminuscule wave 4. The first wave down, wave A of Bitsy degree, had three poorly delineated subwaves, indicating that the corrective pattern will be a Flat. The completion of Subminuscule wave 4 will be followed by a rising Subminuscule wave 5, which will carry the price to new heights.
My alternative analysis pushes wave A down one degree, to the Subbitsy level, making it internal to wave A of Bitsy degree. From the point of view of the aesthetics of the chart, it’s an attractive prospect, since it would provide a clear delineation within Bitsy wave A. I can easily envision promoting this count to the principal analysis.
Learning and other resources. Elliott wave analysis provides context, not prophecy. As the 20th century semanticist Alfred Korzybski put it in his book Science and Sanity (1933), “The map is not the territory … The only usefulness of a map depends on similarity of structure between the empirical world and the map.” And I would add, we can judge that similarity of structure only after the fact.
See the menu page Analytical Methods for a rundown on where to go for information on Elliott wave analysis.
By Tim Bovee, Portland, Oregon, August 18, 2021
Disclaimer
Tim Bovee, Private Trader tracks the analysis and trades of a private trader for his own accounts. Nothing in this blog constitutes a recommendation to buy or sell stocks, options or any other financial instrument. The only purpose of this blog is to provide education and entertainment.
No trader is ever 100 percent successful in his or her trades. Trading in the stock and option markets is risky and uncertain. Each trader must make trading decisions for his or her own account, and take responsibility for the consequences.
License
All content on Tim Bovee, Private Trader by Timothy K. Bovee is licensed under a Creative Commons Attribution-ShareAlike 4.0 International License.
Based on a work at www.timbovee.com.

[…] downtrend, the August 16 peak must mark the end of a 5th wave, rather than the 3rd wave I had in yesterday’s analysis. I accomplished that by recounting the rise from July 19 to July 26, breaking it up into wave 1 […]
LikeLike