3:30 p.m. New York time
Half an hour before the closing bell. The S&P 500 completed a downward movement of five waves and began an upward movement that so far has completed one wave, and is presently in a counter-trend declining second wave. The structure is within wave 1 of Minuscule degree within wave A of Submicro degree within wave 4 of Micro degree. I’ve updated the top chart. No change to the analysis.
10:30 a.m. New York time
What’s happening now? In the last half hour of trading yesterday, the S&P 500 took a dive from 4445.50 on the E-mini futures, falling nearly 100 points before coming to rest early this morning at 4347.25, below the lower boundary of the price channel marking the rise from March 25.
What does it mean? The strength of the decline suggests the beginning of a reversal from a significant top, and I’ve redone my analysis from yesterday to fit that scenario.
What’s the alternative? However, although the price burst through the lower boundary of the price channel, it wasn’t so deep a fall as to break all norms, and it could well be a dramatic correction within a continuing uptrend. Also, from the larger point of the view of the rise that began in February of last year, this drop is barely a dent in the uptrend.
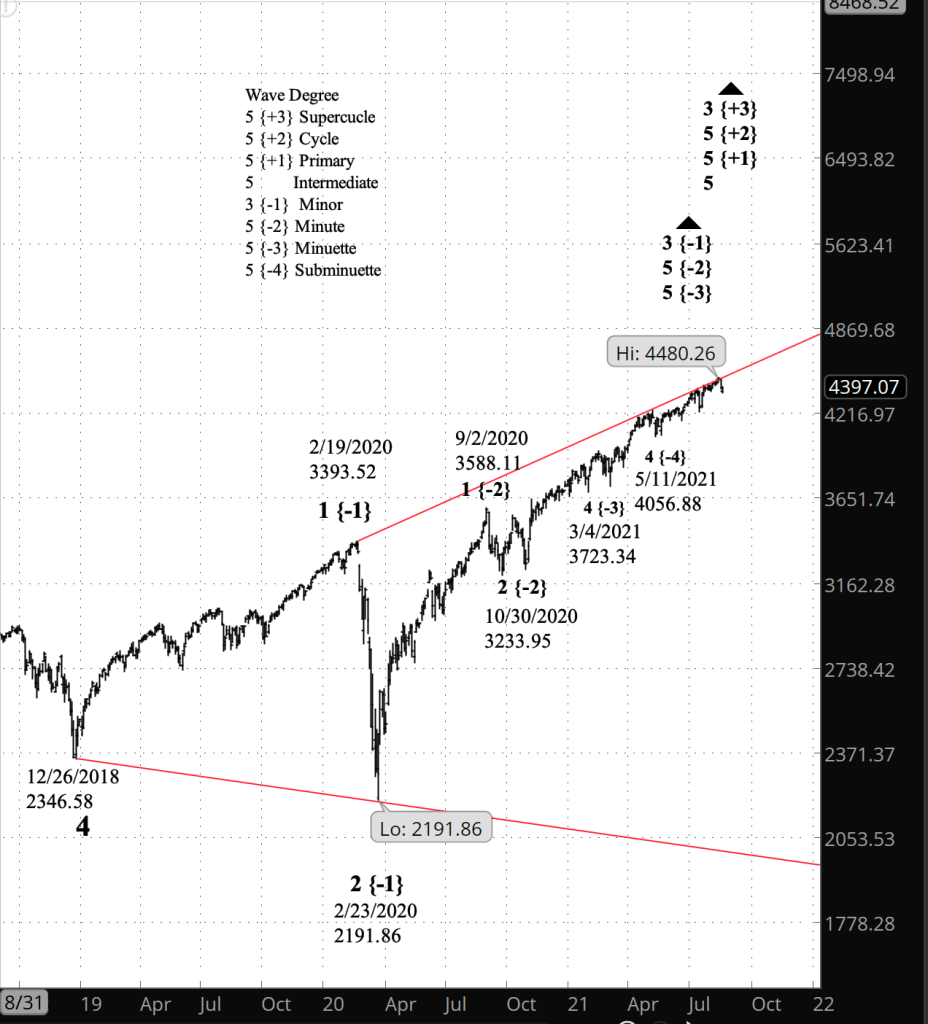
Charts. I’m doing two today, a near-term chart (top chart), showing the re-analysis of the rise from July 19, and a long-term chart (bottom chart) showing the decline from yesterday within the context of the Diagonal Triangle that began in December 2018.
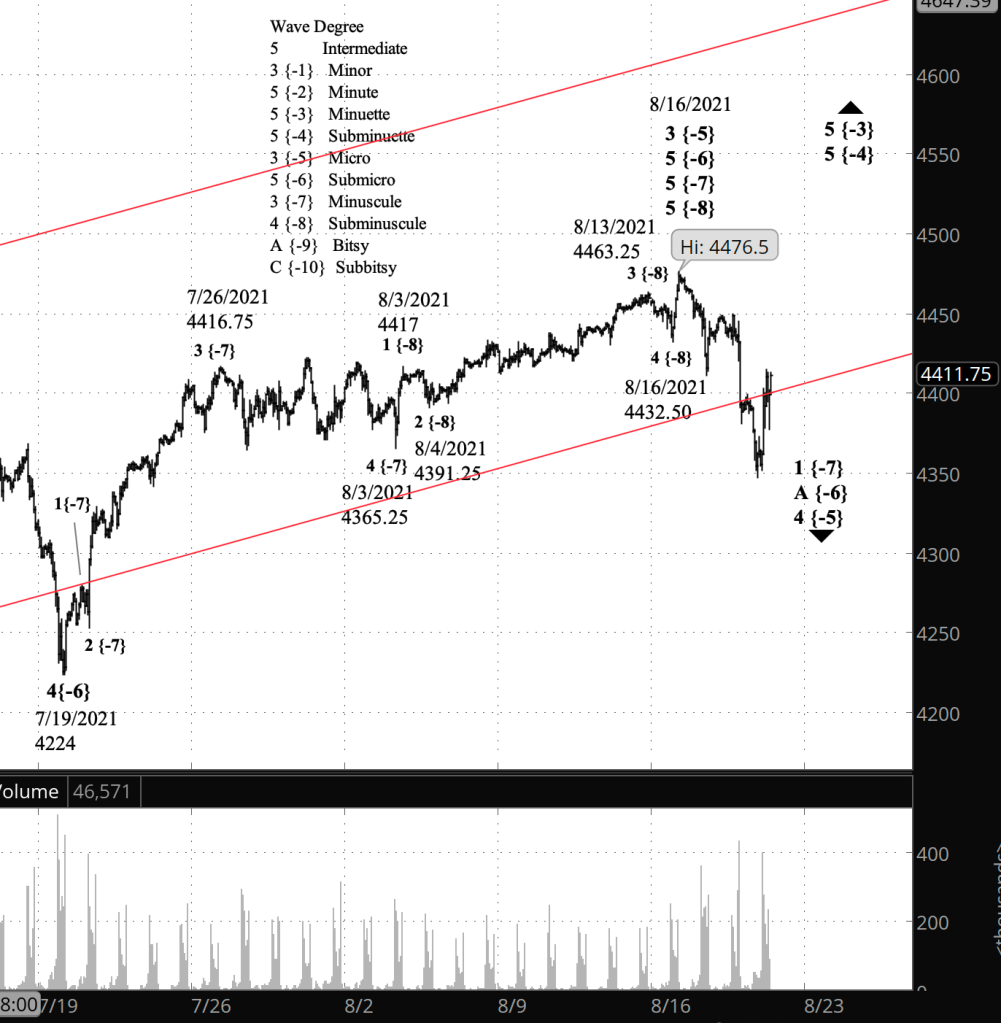
What does Elliott wave theory say? For the principal analysis to work, the peak of August 16, at 4476.50 on the futures, 4480.26 on the index.
For the sharp from yesterday and overnight to work as the beginning of a significant downtrend, the August 16 peak must mark the end of a 5th wave, rather than the 3rd wave I had in yesterday’s analysis. I accomplished that by recounting the rise from July 19 to July 26, breaking it up into wave 1 through 3 of Minuscule degree, rather than a single wave 1. The waves are poorly defined in this energetic movement, but the recount can be made to work.
Under the principal scenario, in ascending order, the August 16 peak marked the end of wave 5 of Subminuscule degree within wave 5 of Minuscule degree within wave 5 of Submicro degree within wave 3 of Micro degree, which began on May 19 from 4055.50.
So the decline from the August 16 high is wave 4 of Micro degree, a correction within a series of ongoing uptrends, in ascending order: Wave 5 of Subminuette degree within wave 5 of Minuette degree within wave 5 of Minute degree within waver 3 of Minor degree within 5th waves of Intermediate, Primary and Cycle degrees within wave 5 of Supercycle degree, which began in 1932.
Under the principal analysis, wave 4 of Micro degree will be followed by a push to new highs as wave 5 of Micro degree and its parent waves, up to Minor degree. Within the Diagonal Triangle that began in December 2018, we are now on wave 3 of Minor degree. That 3rd wave began from the early pandemic low of 2191.86 on February 23, 2020. A Diagonal Triangle has five waves altogether, and Minor wave 3 is not yet complete. When it is, Minor wave 4 will work its way down to the lower boundary of the Diagonal Triangle, which is presently just above 2000 and declining.
Under the alternative analysis, the August 16 peak remains as the end of a low-degree 3rd wave.
Learning and other resources. Elliott wave analysis provides context, not prophecy. As the 20th century semanticist Alfred Korzybski put it in his book Science and Sanity (1933), “The map is not the territory … The only usefulness of a map depends on similarity of structure between the empirical world and the map.” And I would add, we can judge that similarity of structure only after the fact.
See the menu page Analytical Methods for a rundown on where to go for information on Elliott wave analysis.
By Tim Bovee, Portland, Oregon, August 19, 2021
Disclaimer
Tim Bovee, Private Trader tracks the analysis and trades of a private trader for his own accounts. Nothing in this blog constitutes a recommendation to buy or sell stocks, options or any other financial instrument. The only purpose of this blog is to provide education and entertainment.
No trader is ever 100 percent successful in his or her trades. Trading in the stock and option markets is risky and uncertain. Each trader must make trading decisions for his or her own account, and take responsibility for the consequences.
License
All content on Tim Bovee, Private Trader by Timothy K. Bovee is licensed under a Creative Commons Attribution-ShareAlike 4.0 International License.
Based on a work at www.timbovee.com.

You must be logged in to post a comment.