3:30 p.m. New York time
Half an hour before the closing bell. The S&P 500 rose nearly 50 points during the day, from yesterday’s low of 4425.25. No change in the analysis. I’ve updated the chart.
10 a.m. New York time
My trades. I’ve exited by short bear call spread options position on FXI and have updated the entry analysis with results.
9:35 a.m. New York time
What’s happening now? The S&P 500 E-mini futures traded in a narrow range overnight in a low level sideways correction.
What does it mean? The downtrend that began on September 3 continues.
What’s the alternative? The September 3 high marked a turning point within the rise that began May 19, which is still underway.
On the chart. I’ve marked the low-degree waves within the decline that began September 3 as being of Subbitsy degree (with a {-10} subscript). I’ve based that decision on the number of days it takes each wave to reach completion. However, since the decline so far lacks the context of parent waves of larger degree, I’ve have little confidence that Subbitsy is correct. I’ll change my degree label if events should prove it to be too small a degree (I doubt that it will prove too large).
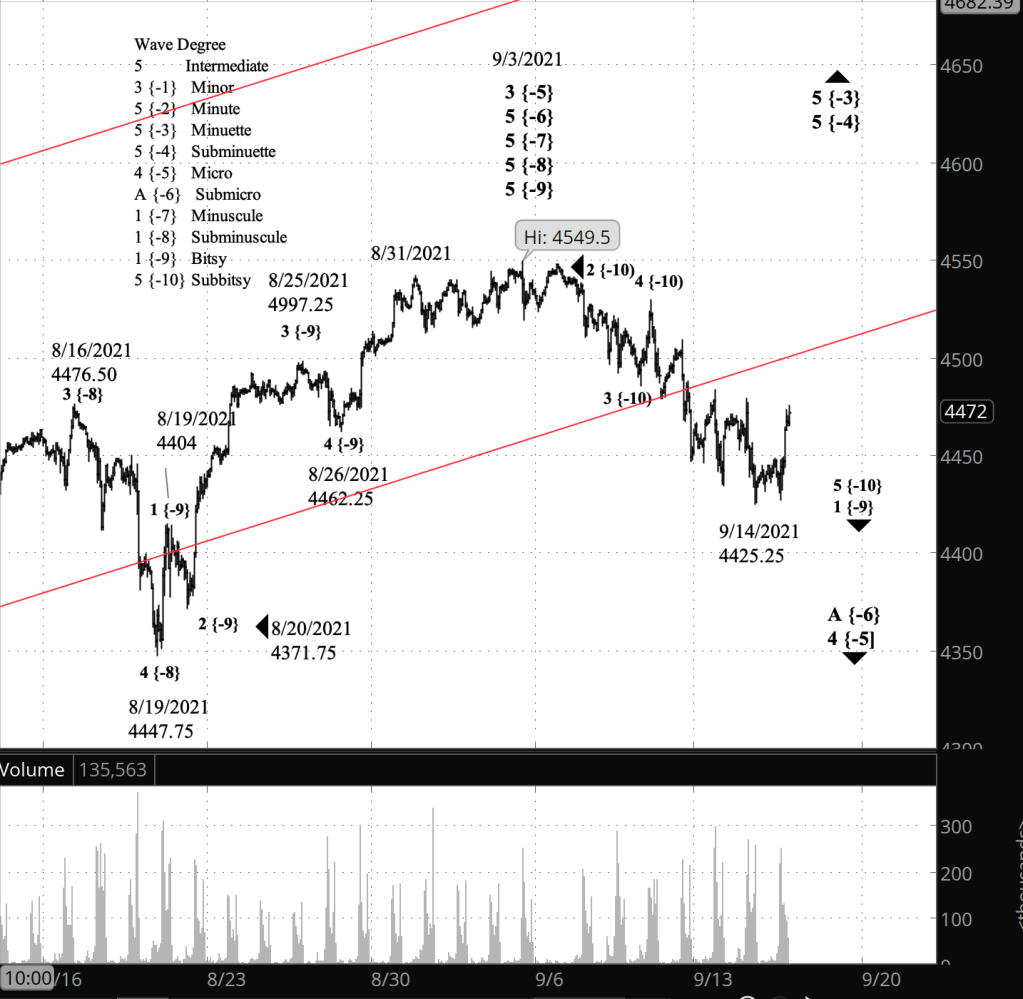
What does Elliott wave theory say? The decline is wave 5 of Subbitsy degree within wave 1 of Bitsy degree within a series of 1st waves of progressively higher degree, up two steps to Minuscule degree. Encompassing them all is wave A of Submicro degree, the first wave within its parent, wave 4 of Micro degree, a downward correction.
Wave 4 of Micro degree will be followed by a 5th wave to the upside that will approach the upper boundary of the price channel, which is based on the Micro degree’s parent, wave 5 of Subminuette degree.
Learning and other resources. Elliott wave analysis provides context, not prophecy. As the 20th century semanticist Alfred Korzybski put it in his book Science and Sanity (1933), “The map is not the territory … The only usefulness of a map depends on similarity of structure between the empirical world and the map.” And I would add, we can judge that similarity of structure only after the fact.
See the menu page Analytical Methods for a rundown on where to go for information on Elliott wave analysis.
By Tim Bovee, Portland, Oregon, September 15, 2021
Disclaimer
Tim Bovee, Private Trader tracks the analysis and trades of a private trader for his own accounts. Nothing in this blog constitutes a recommendation to buy or sell stocks, options or any other financial instrument. The only purpose of this blog is to provide education and entertainment.
No trader is ever 100 percent successful in his or her trades. Trading in the stock and option markets is risky and uncertain. Each trader must make trading decisions for his or her own account, and take responsibility for the consequences.
License
All content on Tim Bovee, Private Trader by Timothy K. Bovee is licensed under a Creative Commons Attribution-ShareAlike 4.0 International License.
Based on a work at www.timbovee.com.

You must be logged in to post a comment.