3:30 p.m. New York time
Half an hour before the closing bell. The S&P 500 E-mini futures ended their decline at 4433.25, eight points above the September 14 low, and then resumed their rise in an upward correction, wave A of Subbitsy degree within wave 4 of Bitsy degree, that began on September 14. No change in the analysis. I’ve updated the chart.
9:35 a.m. New York time
What’s happening now? The S&P 500 E-mini futures rose in overnight trading, reaching 4478.15, and then reversed, staying well above Tuesday’s low.
What does it mean? By my count Tuesday’s low, 4425.25, marks the end of the first leg of the decline that began September 3, from 4549.50. The subsequent rise is the beginning of an upward correction that will remain below the September 3 peak, although it may well approach it quite closely.
What’s the alternative? There are two. 1) The first leg of the decline from September 3 is still underway. This analysis is correct if the price falls below 4425.25 on the futures, 4435.46 on the index.
2) The entire decline is a correction within a still ongoing rise that began May 19. This analysis is correct if the price rises above 4549.50 on the futures, 4545.85 on the index.
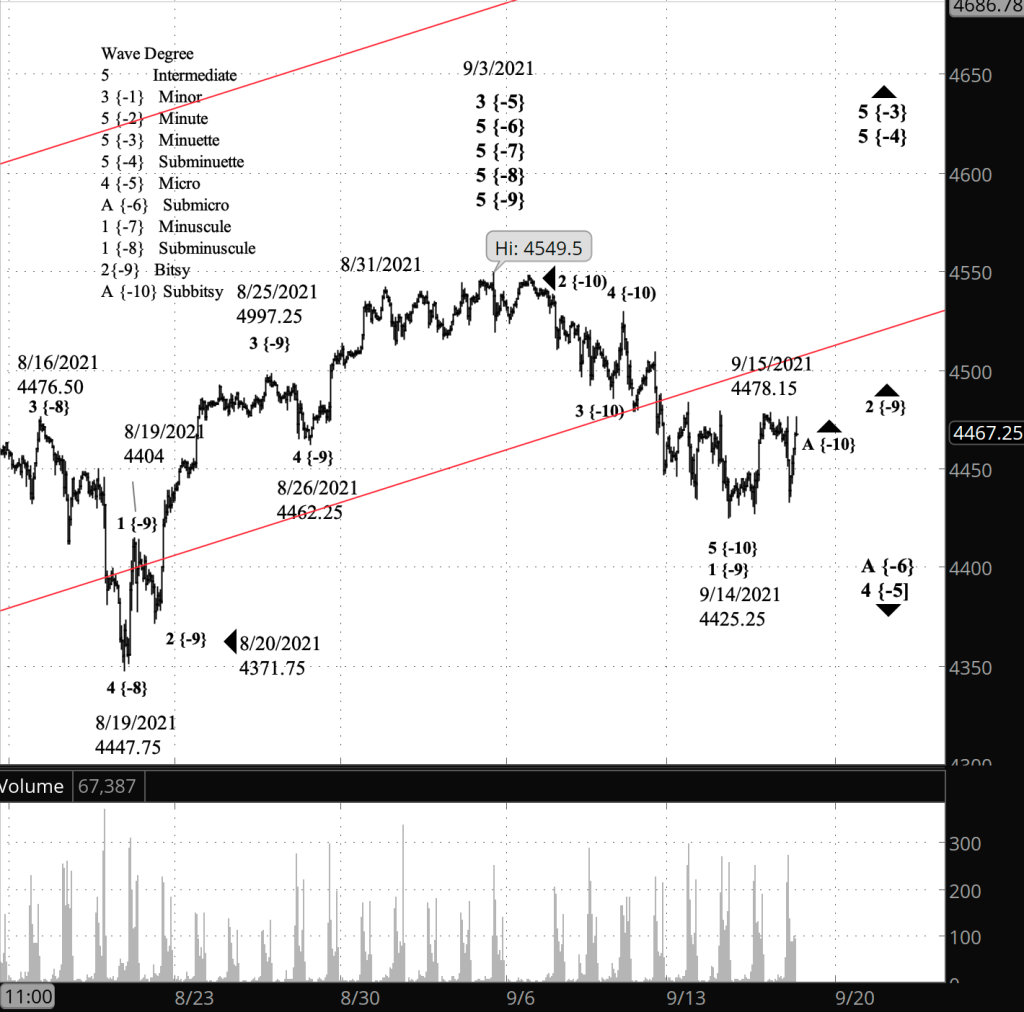
What does Elliott wave theory say? By my principal count, wave 1 of Bitsy degree (subscript {-9}) ended with Tuesday’s low, having completed a five-wave decline, and the subsequent rise is wave 2 of Bitsy degree. Within Bitsy 2, wave A of Subbitsy degree is now underway. Second waves often retrace much of the preceding 1st wave, bringing renewed optimism to traders. However, they remain below the start of the preceding 1st wave, and in the end all hopes are dashed when the correction ends and wave 3 resumes the decline (in this case), brining the price to new lows. This is all happening within wave 4 of Micro degree, which began May 19 and ended at the September 3 peak.
Under the first alternate analysis, Tuesday’s low is not yet the end of wave 1 of Bitsy degree, and it still has a bit more distance downward to go. After that, the 2nd wave begins, as described in the principal anaysis.
Under the second alternate anaysis, wave 3 of Micro degree didn’t end on September 3 and is still underway. The decline that began on that date is a smaller correction within a still rising wave 3 Micro degree.
Learning and other resources. Elliott wave analysis provides context, not prophecy. As the 20th century semanticist Alfred Korzybski put it in his book Science and Sanity (1933), “The map is not the territory … The only usefulness of a map depends on similarity of structure between the empirical world and the map.” And I would add, we can judge that similarity of structure only after the fact.
See the menu page Analytical Methods for a rundown on where to go for information on Elliott wave analysis.
By Tim Bovee, Portland, Oregon, September 16, 2021
Disclaimer
Tim Bovee, Private Trader tracks the analysis and trades of a private trader for his own accounts. Nothing in this blog constitutes a recommendation to buy or sell stocks, options or any other financial instrument. The only purpose of this blog is to provide education and entertainment.
No trader is ever 100 percent successful in his or her trades. Trading in the stock and option markets is risky and uncertain. Each trader must make trading decisions for his or her own account, and take responsibility for the consequences.
License
All content on Tim Bovee, Private Trader by Timothy K. Bovee is licensed under a Creative Commons Attribution-ShareAlike 4.0 International License.
Based on a work at www.timbovee.com.

[…] does Elliott wave theory say? In the near-term, there is no change to my analysis posted yesterday, to which I refer you. The futures price has remained above 4425.25 — the low of September 14 […]
LikeLike