3:30 p.m. New York time
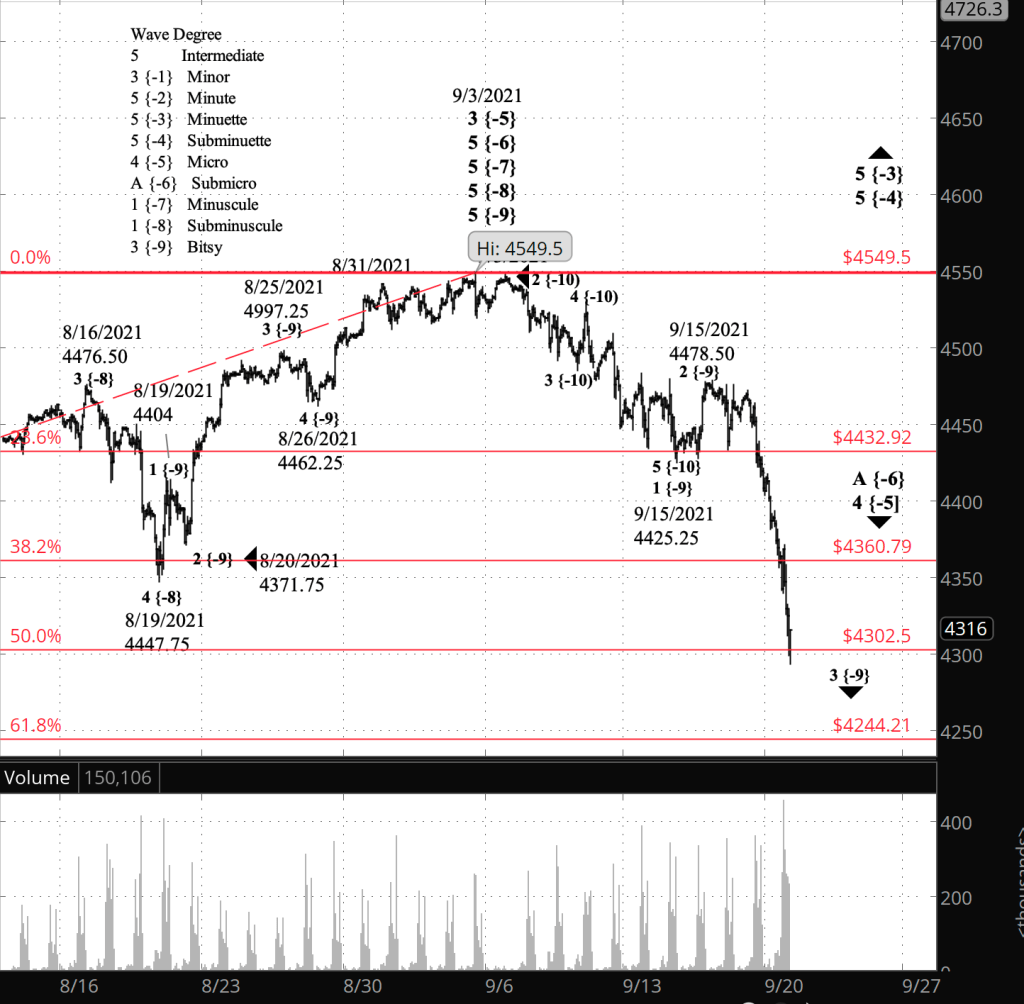
Half an hour before the closing bell. The S&P 500 continued to fall during the day, reaching below 4300. The decline brings wave 4 of Micro degree into the region of a 50% Fibonacci retracement of the preceding 3rd wave. That’s good stopping point. However, internally the wave 4 of Micro degree is still in wave A of Submicro degree. If it’s a sideways Flat-pattern correction, then that would work. If it’s tracing out a Zigzag correction, then it has further to go to the downside.
Given the distance covered by the decline, it’s possible that what I’ve labelled as Bitsy degree is instead a larger degree, perhaps Minuscule, subscript {-7}.
I’ve updated the chart, adding in a Fibonacci retracement ladder for wave 4 of Micro degree, which began on September 3 at 4549.50. The preceding 3rd wave began on May 19 from 4055.5 and ended on September 3.
9:35 a.m. New York time
What’s happening now? The S&P 500 E-mini futures resumed trading early in the evening yesterday at 4411.75 and fell, reaching a low of 4340 shortly after the opening bell.
What does it mean? The sharp decline removes any ambiguity about whether the low-level correction that began on September 15 is complete. It ended later that same day, and the subsequent decline is a resumption of the main downward trend that began on September 3.
What’s the alternative? It remains possible that the decline from September 3 is a correction within the uptrend that began on May 19 from 4055.50. The lower the decline, the less likely this alternative becomes.
What does Elliott wave theory say? In Friday’s post I said that over the weekend I would re-visit my analysis that labelled the September 15 peak as the end of wave 2 of Bitsy degree. I decided at the time that the label was correct, despite the truncated nature of that 2nd wave. The overnight decline supports my decision.
The decline from September 15 is wave 3 of Bitsy degree within wave 1 of Subminuscule degree within wave 1 of Minuscule degree.
Then it gets complicated. Minuscule wave 1 is within a correction, wave A of Submicro degree within wave 4 of Micro degree, which will likely prove to be a sideways correction. That 4th wave is correcting the 3rd wave that came before it — both of Micro degree. That 3rd wave of Micro degree began on May 19 from 4055.50 and ended on September 3 at 4549.50.
The correction is already at the 38.2% Fibonacci level. The next one down is the 50% Fibonacci level, at 4302.50. Either level would be definable as a shallow correction, a characteristic that is common in 4th waves.
The end of Bitsy wave 3 will be followed by a small 4th wave correction to the upside, and then a decline to a new low in the movement. I think that makes the 50% Fibonacci level the more likely end point, but that’s an intuitive guess, not a prediction.
I’m confident enough that wave 4 of MIcro degree is underway that I’ve removed from the chart the price channel for wave 3 of Micro degree.
The end of wave 4 of Micro degree will be followed a rising wave 5, which will carry the price above the September 3 high, 4549.50 on the futures, 4545.85 on the index. The completion of that 5th wave will also mean the end of a series of increasingly larger 5th waves leading up four levels to wave 3 of Minor degree, the rise that began on February 23, 2020 in the low 2000s at the end of the early pandemic crash. The following 4th wave of Minor degree will carry the price down to 2000 or lower.
The alternate scenario, that wave 3 of Micro degree is sill underway, seems less and less likely, given the power of the overnight decline. However, each degree is a structure of its own, and a powerful move at Bitsy degree doesn’t necessarily have meaning for a great-great-great grandparent degree like Micro.
Learning and other resources. Elliott wave analysis provides context, not prophecy. As the 20th century semanticist Alfred Korzybski put it in his book Science and Sanity (1933), “The map is not the territory … The only usefulness of a map depends on similarity of structure between the empirical world and the map.” And I would add, we can judge that similarity of structure only after the fact.
See the menu page Analytical Methods for a rundown on where to go for information on Elliott wave analysis.
By Tim Bovee, Portland, Oregon, September 20, 2021
Disclaimer
Tim Bovee, Private Trader tracks the analysis and trades of a private trader for his own accounts. Nothing in this blog constitutes a recommendation to buy or sell stocks, options or any other financial instrument. The only purpose of this blog is to provide education and entertainment.
No trader is ever 100 percent successful in his or her trades. Trading in the stock and option markets is risky and uncertain. Each trader must make trading decisions for his or her own account, and take responsibility for the consequences.
License
All content on Tim Bovee, Private Trader by Timothy K. Bovee is licensed under a Creative Commons Attribution-ShareAlike 4.0 International License.
Based on a work at www.timbovee.com.

You must be logged in to post a comment.