3:30 p.m. New York time
Half an hour before the closing bell. The S&P 500 completed the first of three parts of its rise that began yesterday and began the second part, a downward correction within an upward correction. In Elliott wave terms, wave B of Submicro degree began yesterday, the present decline is wave 2 of Minuscule degree. Alternatively, what I’ve labeled as Minuscule degree could be one level smaller, a movement of Subminuscule degree, meaning that Minuscule wave 1 is still underway. As labeled, it’s an awfully short 1st wave, covering only 100 points of a retracement of a decline that covered nearly 260 points. I’ve updated the chart. No change in this morning’s analysis.
9:35 a.m. New York time
What’s happening now? The S&P 500 E-mini futures reversed from yesterday’s low of 4293.75, rising to 4395.74 in overnight trading.
What does it mean? Yesterday’s low marked the the first part of a three-part correction that began on September 3, and the subsequent rise is the beginning of the second, middle segment of the correction.
What’s the alternative? The still open question is what size the first two movements are in relation to the broader scope of the market. I discuss the issue in the Elliott wave theory section, below.
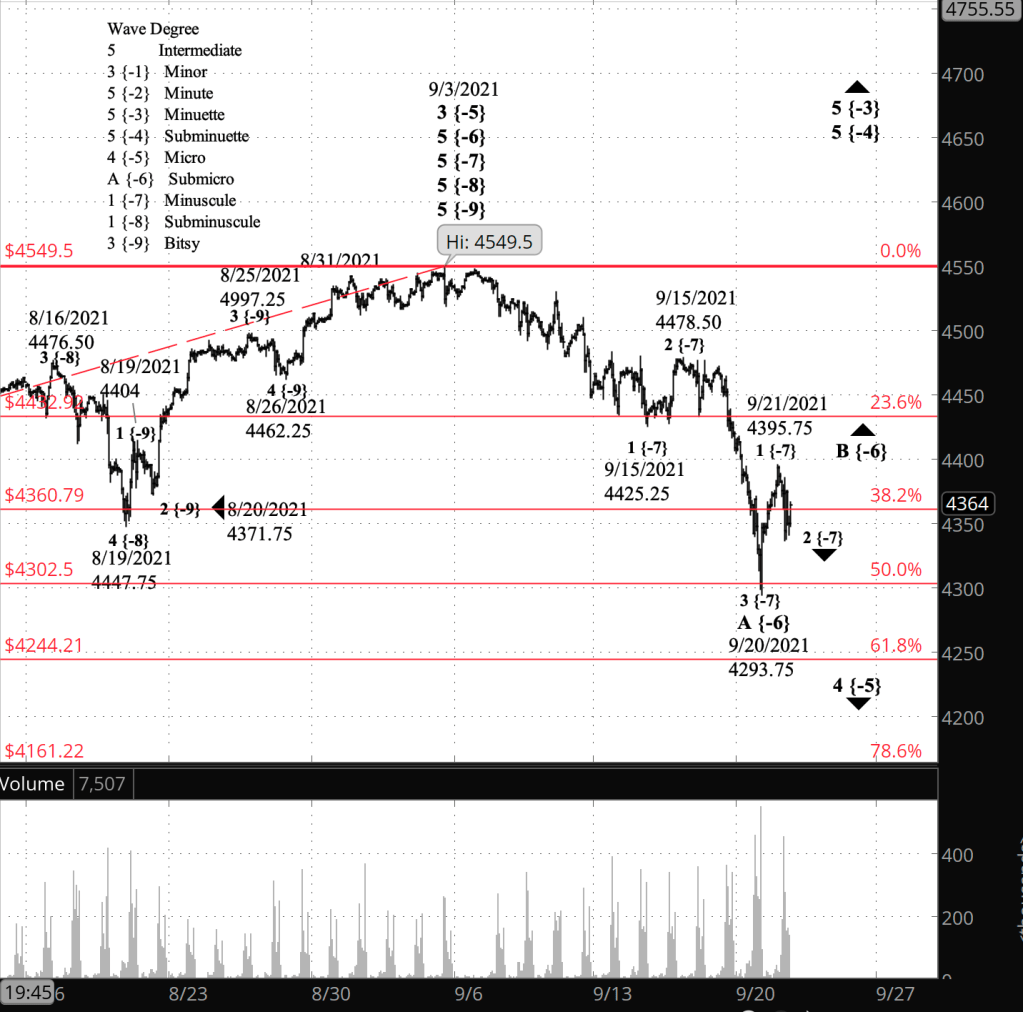
What does Elliott wave theory say? As I noted yesterday, the size of the decline from September 3 suggested that the small-degree labels I had tentatively used for the decline need to be revised. And I have revised them, moving the decline from September 3 to September 20 up by two degrees, from wave 1 of Subminuscule degree to wave A of Submicro degree. The deciding factor was the movement of the price down to a 50% Fibonacci retracement of wave 1 of Micro degree. For a sideways correction, that’s about as much retracement as I can reasonably expect. So the decline defines the whole initial wave of the correction rather than a subwave within that initial movement.
So, the context. The low of September 20 marked the end of wave A of Submicro degree within a correction, wave 4 of Micro degree, within wave 5 of Subminuette degree, within wave 5 of Minuette degree, within wave 5 of Minute degree, within wave 3 of Minor degree, which began more than a year ago,on February 23, 2020, from the low 2000s.
But dropping back to the small scale, how do we know that wave A of Submicro degree is complete? The two most common corrective patterns are Zigzags and Flats. Zigzags cover more territory than Flats, and the two alternate; if a 2nd wave is a Zigzag, then the 4th wave will almost always be a Flat. The number of subwaves within each segment of the correction provides a clue as to the form that market is tracing out. A Zigzag has five waves in the first segment, three in the middle, and five in the final segment, a 5-3-5 pattern. A Flat has a 3-3-5 pattern.
On the chart, the decline from September 3 to September 20 has three subwaves internally, suggesting that we’re seeing a Flat pattern for wave 4. Also, the preceding wave 2 correction was a Zigzag, so a Flat an be expected for the 45th wave.
We can expect to see three waves to the upside for wave B of Submicro degree, and then a C wave back to around 4300. At that point, either the wave 4 of MIcro degree correction is over and wave 5 of Micro degree has begun, eventually carrying the price to new heights. Or, as often happens, there will be an X wave to the upside that will divide the first corrective pattern from a second one in a compound structure.
Learning and other resources. Elliott wave analysis provides context, not prophecy. As the 20th century semanticist Alfred Korzybski put it in his book Science and Sanity (1933), “The map is not the territory … The only usefulness of a map depends on similarity of structure between the empirical world and the map.” And I would add, we can judge that similarity of structure only after the fact.
See the menu page Analytical Methods for a rundown on where to go for information on Elliott wave analysis.
By Tim Bovee, Portland, Oregon, September 21, 2021
Disclaimer
Tim Bovee, Private Trader tracks the analysis and trades of a private trader for his own accounts. Nothing in this blog constitutes a recommendation to buy or sell stocks, options or any other financial instrument. The only purpose of this blog is to provide education and entertainment.
No trader is ever 100 percent successful in his or her trades. Trading in the stock and option markets is risky and uncertain. Each trader must make trading decisions for his or her own account, and take responsibility for the consequences.
License
All content on Tim Bovee, Private Trader by Timothy K. Bovee is licensed under a Creative Commons Attribution-ShareAlike 4.0 International License.
Based on a work at www.timbovee.com.

You must be logged in to post a comment.