3:30 p.m. New York time
Half an hour before the closing bell. The S&P 500 continued its rise throughout the day. Wave 3 of Minuscule degree within wave B of Submicro degree continues. No change in the analysis. I’ve updated the chart.
9:35 a.m. New York time
What’s happening now? The S&P 500 E-mini futures in overnight trading continued to work their way up the second part of an upward correction that began September 20.
What does it mean? A corrective pattern comes in three parts — down, up, down in this case — and the correction is presently in the middle, rising portion of its pattern. Internally, the middle leg has completed two waves and is presently in its third.
What’s the alternative? The open question is the relative size of the waves internal to the middle leg. More on that in the Elliott wave theory section, below.
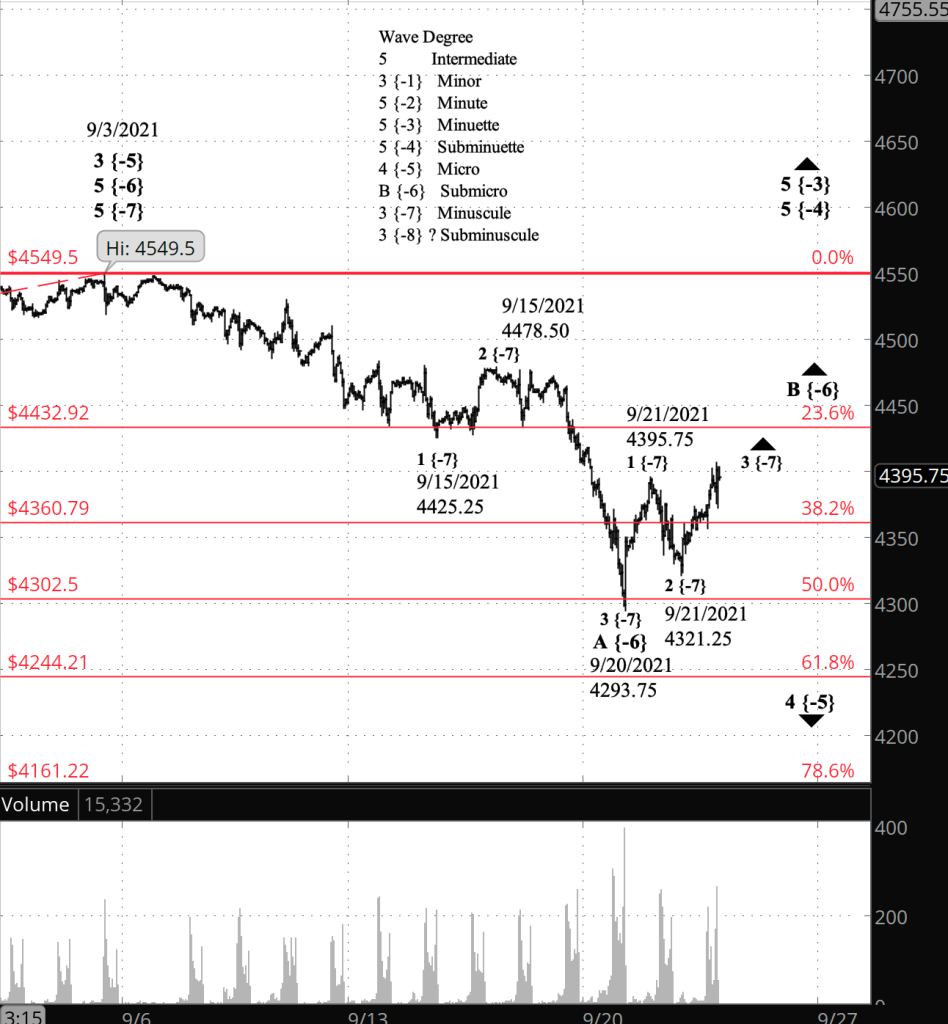
What does Elliott wave theory say? The present correction is wave 4 of Micro degree. It is taking the form of a Flat, which means that internally, waves A and B will have three waves, and wave C will have five. Because of the fractal nature of market patterns, each internal wave within A, B and C will have its own, smaller internal waves that fit the patterns of Elliott wave theory. The patterns of the markets are identical at all levels, from a 50-year chart with quarterly bars down to the a daily chart with one-minute bars.
Waves A, B and the future C are of Submicro degree, and I have labelled the internal waves one level smaller, as Minuscule degree. But is that correct? Assessing the relative size of a wave in an ongoing pattern is often a matter of luck and intuition. If my Minuscule degree labelling is correct, then wave B will have three waves internally. If those waves should instead be one level lower, at Subminuscule degree with a subscript {8}, then we can expect five waves before Minuscule wave 1 within Subicro wave B is complete.
The price is presently near a 38.2% Fibonacci retracement of the preceding wave 3 of Micro degree, or 4360.79. The next major stopping point on the Fibonacci ladder is 23.6%, and the price at that level is 4432.92.
Learning and other resources. Elliott wave analysis provides context, not prophecy. As the 20th century semanticist Alfred Korzybski put it in his book Science and Sanity (1933), “The map is not the territory … The only usefulness of a map depends on similarity of structure between the empirical world and the map.” And I would add, we can judge that similarity of structure only after the fact.
See the menu page Analytical Methods for a rundown on where to go for information on Elliott wave analysis.
By Tim Bovee, Portland, Oregon, September 22, 2021
Disclaimer
Tim Bovee, Private Trader tracks the analysis and trades of a private trader for his own accounts. Nothing in this blog constitutes a recommendation to buy or sell stocks, options or any other financial instrument. The only purpose of this blog is to provide education and entertainment.
No trader is ever 100 percent successful in his or her trades. Trading in the stock and option markets is risky and uncertain. Each trader must make trading decisions for his or her own account, and take responsibility for the consequences.
License
All content on Tim Bovee, Private Trader by Timothy K. Bovee is licensed under a Creative Commons Attribution-ShareAlike 4.0 International License.
Based on a work at www.timbovee.com.

[…] does Elliott wave theory say? The analysis is unchanged from yesterday’s post: A rising wave B of a Submicro degree correction within a declining wave 4 of Micro degree […]
LikeLike