3:30 p.m. New York time
Half an hour before the closing bell. The S&P 500 fell during the trading session, on the futures to within eight points of Friday’s low, and then reversed. No change in the analysis. I’ve updated the chart.
9:35 a.m. New York time
What’s happening now? The S&P 500 declined in overnight trading to about 50 points below Friday’s high, reaching a low of 4315. From that low it rose slightly as the opening bell approached.
What does it mean? The decline appears to be a downward correction within the early portion of a rise that began October 1 and under my principle scenario eventually can be expected to exceed the September 3 high, 4549.50.
What’s the alternative? The rise could prove to be a shorter rise and fall separating two corrective patterns in a compound structure. Under this alternative scenario, the price will begin its rise to new highs, but later than is the case under the principle scenario.
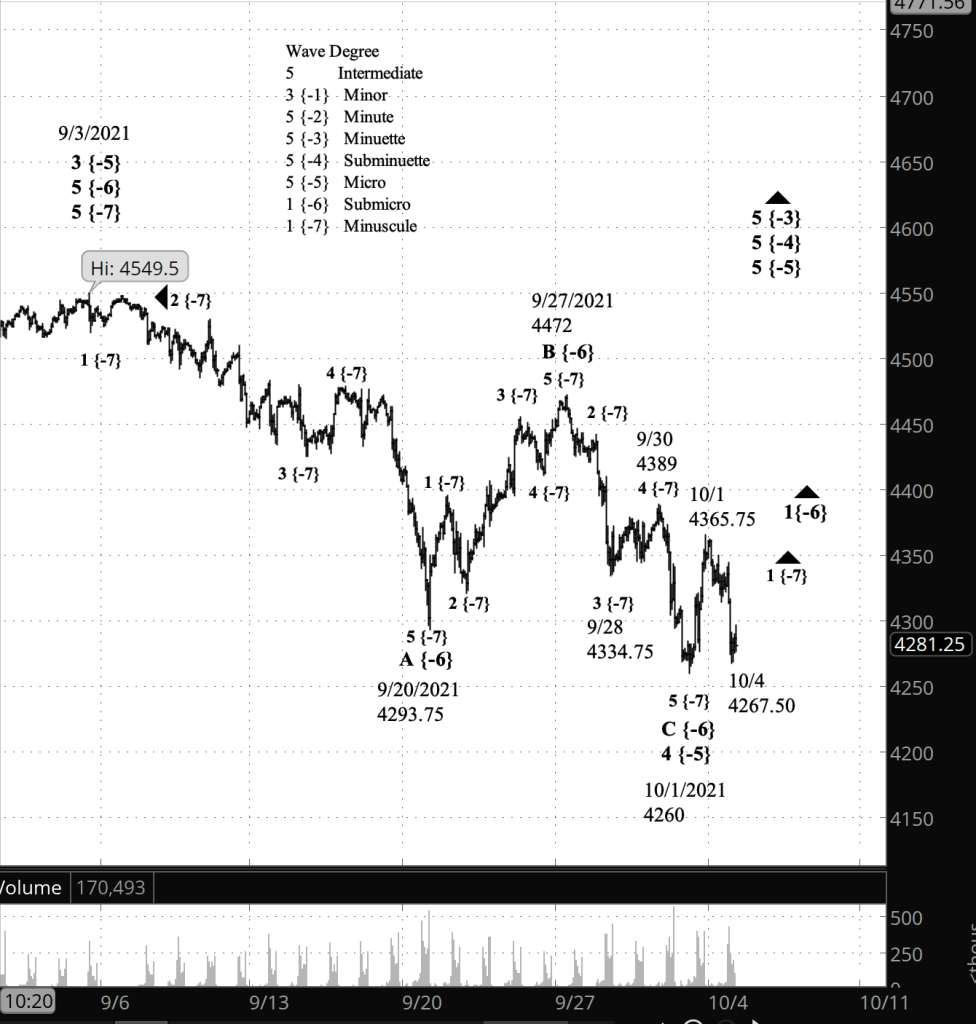
What does Elliott wave theory say? Under my principle analysis the decline from October 1 is 2nd wave within wave 1 of Minuscule degree within wave 1 of Submicro degree within a series of 5th waves of increasing size, from Micro degree up to Minute degree. All of this is taking place within wave 3 of Minor degree. The completion of Minor wave 3 will be followed by a 4th wave that will carry the price down to the low 2000s or below, to the lower boundary of a Diagonal Triangle that began on December 26, 2018.
The alternative analysis is the same as the principle analysis, except that wave 1 of Minuscule degree, with all of its parent waves, will be delayed by a second corrective pattern. Under this scenario, the rise tat began October 1 is wave X of Submicro degree separating the first corrective pattern within wave 4 of Micro degree, which began on September 3, from a second corrective pattern which could well take a month or so to reach completion. At the end of that second pattern, the principle scenario described above will begin.
Learning and other resources. Elliott wave analysis provides context, not prophecy. As the 20th century semanticist Alfred Korzybski put it in his book Science and Sanity (1933), “The map is not the territory … The only usefulness of a map depends on similarity of structure between the empirical world and the map.” And I would add, we can judge that similarity of structure only after the fact.
See the menu page Analytical Methods for a rundown on where to go for information on Elliott wave analysis.
By Tim Bovee, Portland, Oregon, October 4, 2021
Disclaimer
Tim Bovee, Private Trader tracks the analysis and trades of a private trader for his own accounts. Nothing in this blog constitutes a recommendation to buy or sell stocks, options or any other financial instrument. The only purpose of this blog is to provide education and entertainment.
No trader is ever 100 percent successful in his or her trades. Trading in the stock and option markets is risky and uncertain. Each trader must make trading decisions for his or her own account, and take responsibility for the consequences.
License
All content on Tim Bovee, Private Trader by Timothy K. Bovee is licensed under a Creative Commons Attribution-ShareAlike 4.0 International License.
Based on a work at www.timbovee.com.

You must be logged in to post a comment.