3:30 p.m. New York time
Half an hour before the closing bell. The S&P 500 continued to rise during the day. No change in the analysis. I’ve updated the chart.
1:55 p.m. New York time
Today’s Trades. Long put positions on PAAS and SPCE.
Today is the optimal day for entering short spreads whose options expire on November 19. I couldn’t find anything I liked; the risk-reward ratios were simply way too high. I’ll keep looking. The window for entry will be open through October 12.
9:35 a.m. New York time
What’s happening now? The S&P 500 E-mini futures continued to rise in overnight trading, remaining above yesterday’s low of 4267.50.
What does it mean? The present rise is the third leg within a larger upward trend that began on October 1. It will continue to work its way higher, eventually exceeding the September 3 peak, 4549.50.
What’s the alternative? The rise could be a separator within a compound correction. One corrective pattern is complete, and the separator sets the stage for a second corrective pattern.
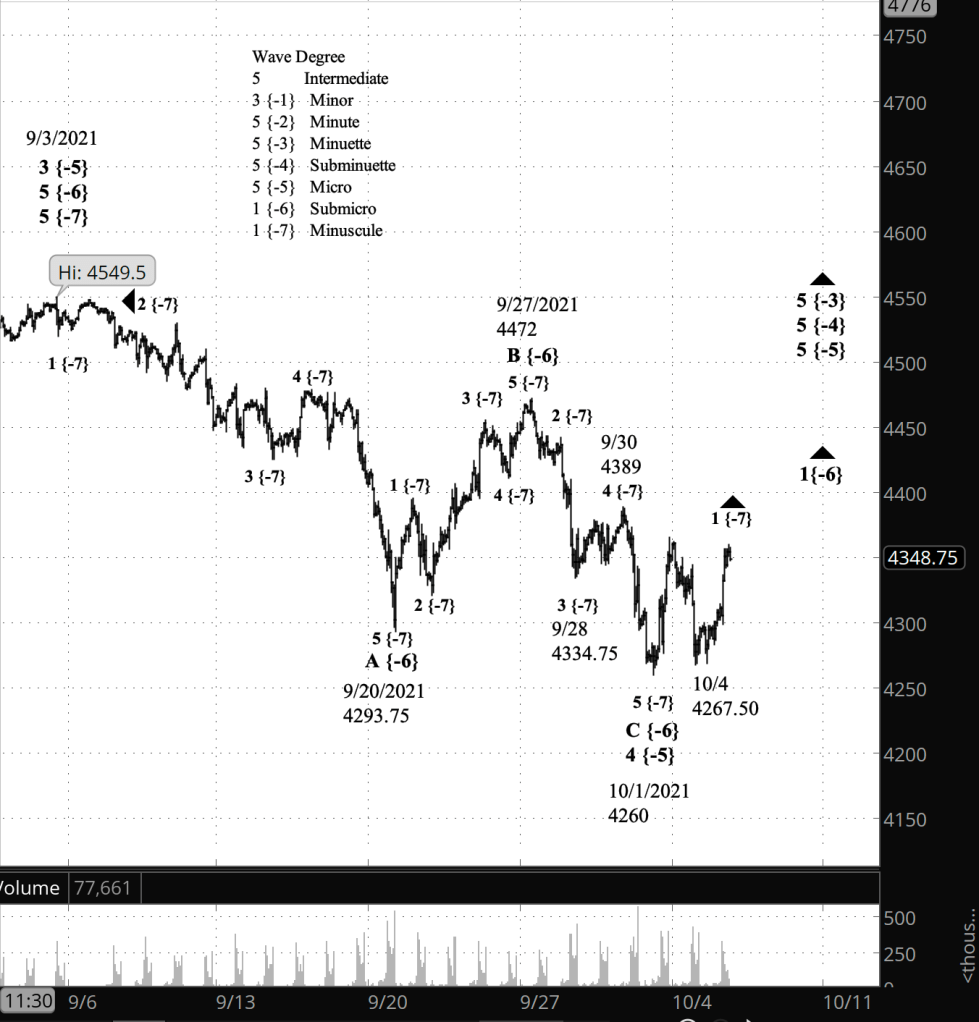
What does Elliott wave theory say? The rise that began yesterday from 4267.50 is the 3rd wave within wave 1 of Minuscule degree within the larger wave 1 of Submicro degree. This is all happening within a series of 5th waves, in order of increasing size, of MIcro, Subinuette, Minuette and Minute degrees, which in turn are subwaves of wave 3 of Minor degree, part of a Diagonal Triangle that began in December 2018, forming the 5th wave of Intermediate degree. Minor wave 3 will carry the price to new highs, above the prior peak of 4549.50, set on September 3. The subsequent Minor wave 4 will carry the price to to the lower boundary of the Triangle, which is presently below 2050 and continuing to move lower.
Under the alternative analysis, the present rise is part of wave X of Submicro degree, which separates two corrective patterns within a compound correction, wave 4 of Micro degree. The first corrective pattern, a Zigzag, ended on October 1, having lasted nearly a month. The second pattern, which will begin after wave X, might well last a similar amount of time. When it is done, then we can expect the rise to new highs described in the principle analysis.
The higher the price goes, the more likely the principle analysis is corrective. If the price reverses and falls bellow the October 1 low of 4260, then the alternate scenario becomes the most likely.
Learning and other resources. Elliott wave analysis provides context, not prophecy. As the 20th century semanticist Alfred Korzybski put it in his book Science and Sanity (1933), “The map is not the territory … The only usefulness of a map depends on similarity of structure between the empirical world and the map.” And I would add, we can judge that similarity of structure only after the fact.
See the menu page Analytical Methods for a rundown on where to go for information on Elliott wave analysis.
By Tim Bovee, Portland, Oregon, October 5, 2021
Disclaimer
Tim Bovee, Private Trader tracks the analysis and trades of a private trader for his own accounts. Nothing in this blog constitutes a recommendation to buy or sell stocks, options or any other financial instrument. The only purpose of this blog is to provide education and entertainment.
No trader is ever 100 percent successful in his or her trades. Trading in the stock and option markets is risky and uncertain. Each trader must make trading decisions for his or her own account, and take responsibility for the consequences.
License
All content on Tim Bovee, Private Trader by Timothy K. Bovee is licensed under a Creative Commons Attribution-ShareAlike 4.0 International License.
Based on a work at www.timbovee.com.

You must be logged in to post a comment.