3:30 p.m. New York time
Half an hour before the closing bell. The S&P 500 spent the session trading in a narrow range as the sideways-trending wave 4 of Minuscule degree continued on its course. No change in the analysis. I’ve updated the upper chart.
2:50 p.m. New York time
My trades. I’ve exited my long call position on GM for a profit.
9:35 a.m. New York time
What’s happening now? In overnight trading, the S&P 500 E-mini futures declined by nearly 40 points from yesterday’s peak of 4420.50.
What does it mean? The decline is the second correction in the early stage of the uptrend that began October 1. Once the correction is over, the price will resume its rise, eventually exceeding 4549.50, the high set on September 3.
What’s the alternative? It remains possible that the rise from October 1 is a separator between two corrective patterns in a compound structure. Under this scenario the uptrend lies in the future, having not yet begun.
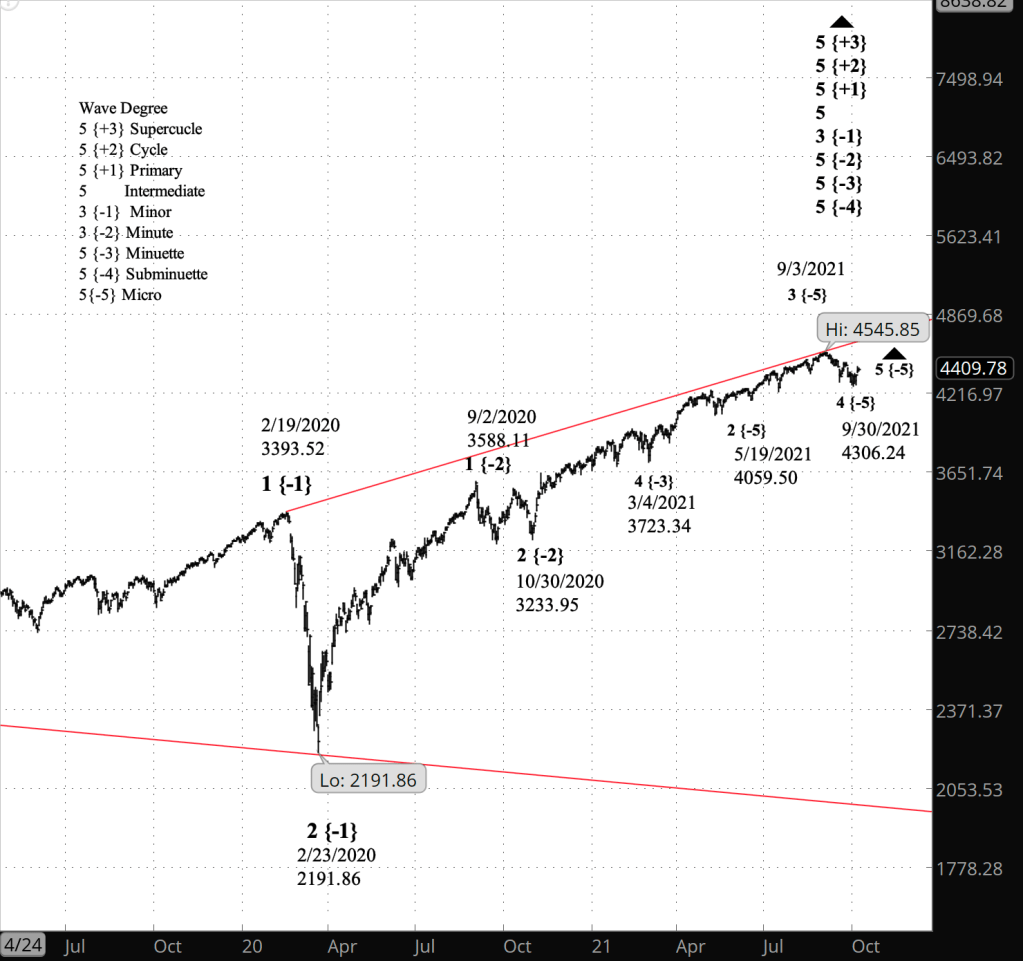
Charts. The upper chart is a near-term view of the S&P 500 E-mini futures; the lower chart shows a longer-term view, dating back to the early pandemic crash.
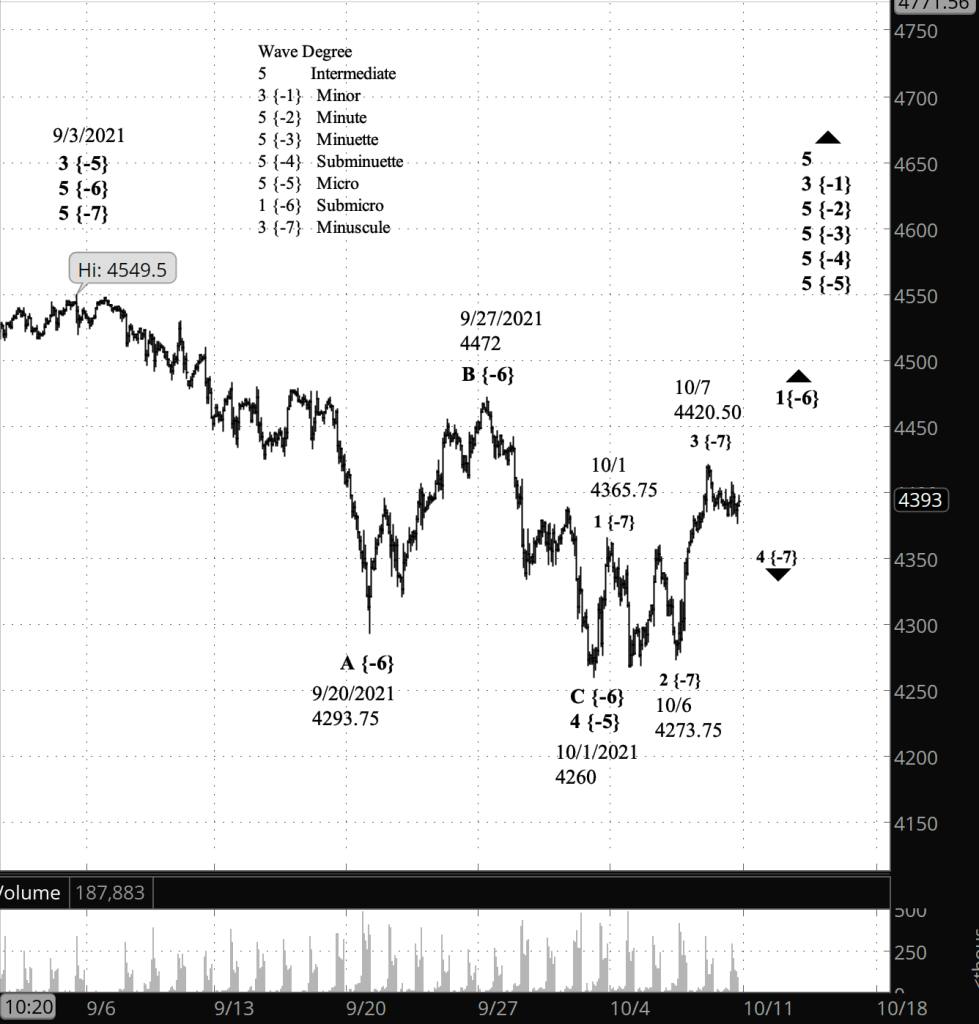
What does Elliott wave theory say? Upper chart: Under my principle analysis, the S&P 500 has begun a 4th wave of Minuscule degree within wave 1 of Submicro degree. Minuscule 4, which will most likely be a Flat, will be followed by a 5th wave to the upside which, when it ends, will also mark the end of Submicro 1 and the beginning of a Submicro 2 correction. Second waves often retrace much of the preceding 1st wave, and so the price could again dip below 4300, while remaining above 4260, the low of October 1. The end of Submicro 2 will mark the start of wave 3 of Submicro degree, which will carry the price beyond recent levels.
Under the alternative scenario, the rise from October 1 and the future decline is wave X of Submicro degree, marking the division among two corrective patterns in a compound structure.
The lower chart shows the boundaries of an expanding Diagonal Triangle that began in December 2018. The 3rd wave of Minor degree is presently at the upper boundary. It will eventually approach the lower boundary as a 4th wave and then rise again to the upper boundary in a 5th and final wave.
Learning and other resources. Elliott wave analysis provides context, not prophecy. As the 20th century semanticist Alfred Korzybski put it in his book Science and Sanity (1933), “The map is not the territory … The only usefulness of a map depends on similarity of structure between the empirical world and the map.” And I would add, we can judge that similarity of structure only after the fact.
See the menu page Analytical Methods for a rundown on where to go for information on Elliott wave analysis.
By Tim Bovee, Portland, Oregon, October 8, 2021
Disclaimer
Tim Bovee, Private Trader tracks the analysis and trades of a private trader for his own accounts. Nothing in this blog constitutes a recommendation to buy or sell stocks, options or any other financial instrument. The only purpose of this blog is to provide education and entertainment.
No trader is ever 100 percent successful in his or her trades. Trading in the stock and option markets is risky and uncertain. Each trader must make trading decisions for his or her own account, and take responsibility for the consequences.
License
All content on Tim Bovee, Private Trader by Timothy K. Bovee is licensed under a Creative Commons Attribution-ShareAlike 4.0 International License.
Based on a work at www.timbovee.com.

You must be logged in to post a comment.