3:30 p.m. New York time
Half an hour before the closing bell. The S&P 500 fell into the afternoon from a morning high of 4407.50 on the futures, remaining above the Sunday night low. Wave 4 of Minuscule degree continues. No change in the analysis. Chart updated.
9:35 a.m. New York time
What’s happening now? The S&P 500 E-mini futures reached a low of 4352.25 when trading resumed Sunday evening and rose slightly.
What does it mean? The low and reversal were a continuation of a shallow correction within an uptrend. The low may have marked the end of the first of, most likely, three segments within the correction, although that is not a certainty.
What’s the alternative? It remains possible that the uptrend is in fact a separator within a larger ongoing downward correction. The separator will be followed by another corrective pattern in a compound structure.
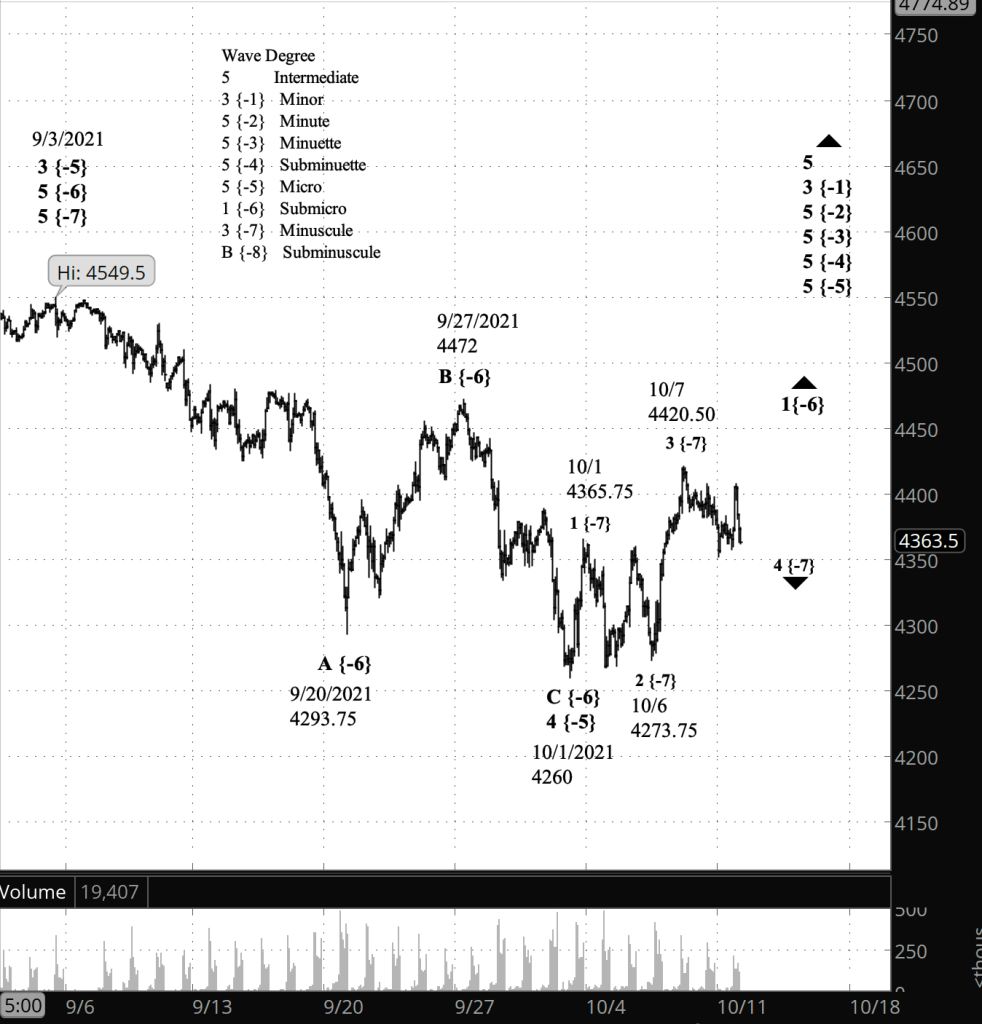
What does Elliott wave theory say? Under principle scenario, the shallow correction — wave 4 of of Minuscule degree — began on October 7 and is possibly in the second segment internally, wave B of Subminuscule degree.
The pattern is happening within wave 5 of Micro degree, which began on October 1. The 5th wave will eventually move above the preceding 3rd wave, which ended on September 3 at 4549.50, and the move could carry the price significantly above that level.
Under the alternative scenario, wave 5 of Micro degree has not yet begun. Instead, wave 4 of Micro degree is forming a compound structure, and the rise from October 1 is wave X of Submicro degree, separating the now complete first corrective pattern from a second corrective pattern that has not yet begun.
Learning and other resources. Elliott wave analysis provides context, not prophecy. As the 20th century semanticist Alfred Korzybski put it in his book Science and Sanity (1933), “The map is not the territory … The only usefulness of a map depends on similarity of structure between the empirical world and the map.” And I would add, we can judge that similarity of structure only after the fact.
See the menu page Analytical Methods for a rundown on where to go for information on Elliott wave analysis.
By Tim Bovee, Portland, Oregon, October 11, 2021
Disclaimer
Tim Bovee, Private Trader tracks the analysis and trades of a private trader for his own accounts. Nothing in this blog constitutes a recommendation to buy or sell stocks, options or any other financial instrument. The only purpose of this blog is to provide education and entertainment.
No trader is ever 100 percent successful in his or her trades. Trading in the stock and option markets is risky and uncertain. Each trader must make trading decisions for his or her own account, and take responsibility for the consequences.
License
All content on Tim Bovee, Private Trader by Timothy K. Bovee is licensed under a Creative Commons Attribution-ShareAlike 4.0 International License.
Based on a work at www.timbovee.com.

You must be logged in to post a comment.