4 p.m. New York time
At the closing bell. Three minutes before the closing bell the S&P 500 index rose above the September 3 high of 4545.85, reaching a new peak of 4551.44. The S&P 500 futures remained below the September 3 high. This has no effect on my analysis.
3:30 p.m. New York time
Half an hour before the closing bell. The S&P 500 climbed during the day to 4537.50, exceeding yesterday’s high but remaining below the September 3 all-time high of 4549.50. I’ve updated the chart, adding a dotted line at the level of the September 3 peak.
9:55 a.m. New York time
What’s happening now? The S&P 500 E-mini futures stayed below yesterday’s high, 4532.25, in overnight trading.
What does it mean? The rise that began October 1 is still rising but nearing the end of its middle leg, which will be followed by a shallow correction and then a move to new highs. .
What’s the alternative? Or, possibly, the price will reach above the previous peak, 4549.50 attained on September 3, before the shallow correction begins. The uncertainty lies in how much energy the rise from October 1 still has in it.
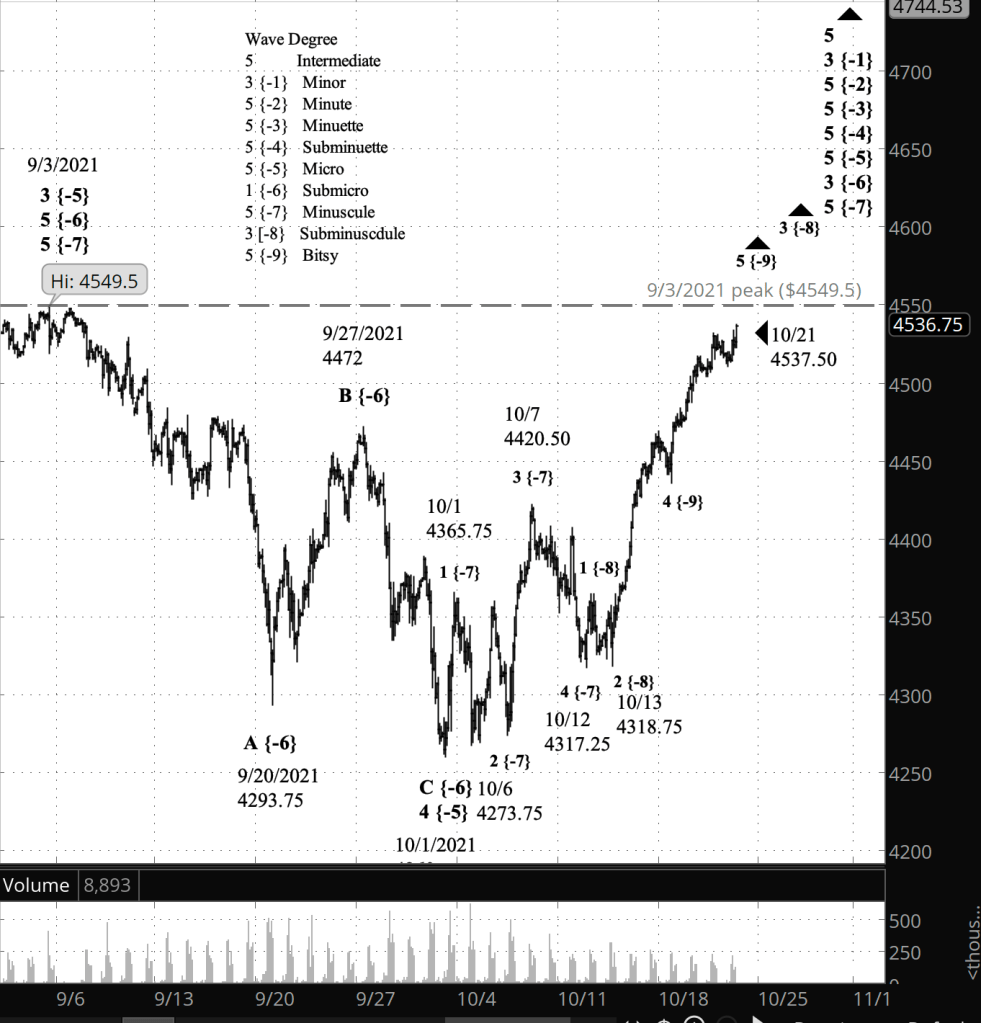
What does Elliott wave theory say? The rise from October 1 is wave 5 of Minuscule degree within wave 3 of Submicro degree. Within Minuscule 5, from larger to smaller, the price is tracing wave 3 of Subminuscule degree, its child wave 5 of Bitsy degree, and — unlabelled on the chart — its grandchild, wave 5 of Subbitsy degree. I’m less certain of the Subbitsy count, and indeed, yesterday’s high may in fact be the end of Subitsy 5, Bitsy 5 and Subminuscule 3, and the beginnging of the 4th wave of Subminusule degree, a shallow correction.
Learning and other resources. Elliott wave analysis provides context, not prophecy. As the 20th century semanticist Alfred Korzybski put it in his book Science and Sanity (1933), “The map is not the territory … The only usefulness of a map depends on similarity of structure between the empirical world and the map.” And I would add, we can judge that similarity of structure only after the fact.
See the menu page Analytical Methods for a rundown on where to go for information on Elliott wave analysis.
By Tim Bovee, Portland, Oregon, October 21, 2021
Disclaimer
Tim Bovee, Private Trader tracks the analysis and trades of a private trader for his own accounts. Nothing in this blog constitutes a recommendation to buy or sell stocks, options or any other financial instrument. The only purpose of this blog is to provide education and entertainment.
No trader is ever 100 percent successful in his or her trades. Trading in the stock and option markets is risky and uncertain. Each trader must make trading decisions for his or her own account, and take responsibility for the consequences.
License
All content on Tim Bovee, Private Trader by Timothy K. Bovee is licensed under a Creative Commons Attribution-ShareAlike 4.0 International License.
Based on a work at www.timbovee.com.

You must be logged in to post a comment.