3:30 p.m. New York time
Half an hour before the closing bell. The S&P 500 peaked at 4551.50 on the futures, 4559.67 on the index, and then immediately withdrew by 36 points on the futures, bouncing up again in a clear corrective pattern of very small degree. The price so far remains below the peak. I’ve marked the upper, near-term chart based on a scenario that peak marked the end of wave 5 of Subminuscule degree. That scenario makes the 3rd the shortest wave, followed by the 5th and then the 1st. This meets the strict Elliott wave analysis rule that the 3rd wave cannot be the shortest wave in the direction of the trend. If events prove 4551.50 to not be the end of Subminuscule 5, then I’ll reanalyze the chart. Upper chart updated.
10:45 a.m. New York time
New all-time high. The S&P 500 E-mini futures moved to an all-time high of 4551.50 so far, exceeding the September 3 peak of 4549.50. This follows the index, which set a new peak yesterday.
9:35 a.m. New York time
What’s happening now? The S&P 500 E-mini futures continued to rise during the night, reaching 4548, which is 1.50 below the September 3 high. The S&P 500 index exceeded the early September high in yesterday’s trading.
What does it mean? The rise that began on October 13 continues and is in its last leg. When the rise is complete, it will be followed by a shallow correction and then a rise to new heights.
What’s the alternative? The chart is unambiguous at this point and I have no alternative analysis. Ambiguities can develop at any time.
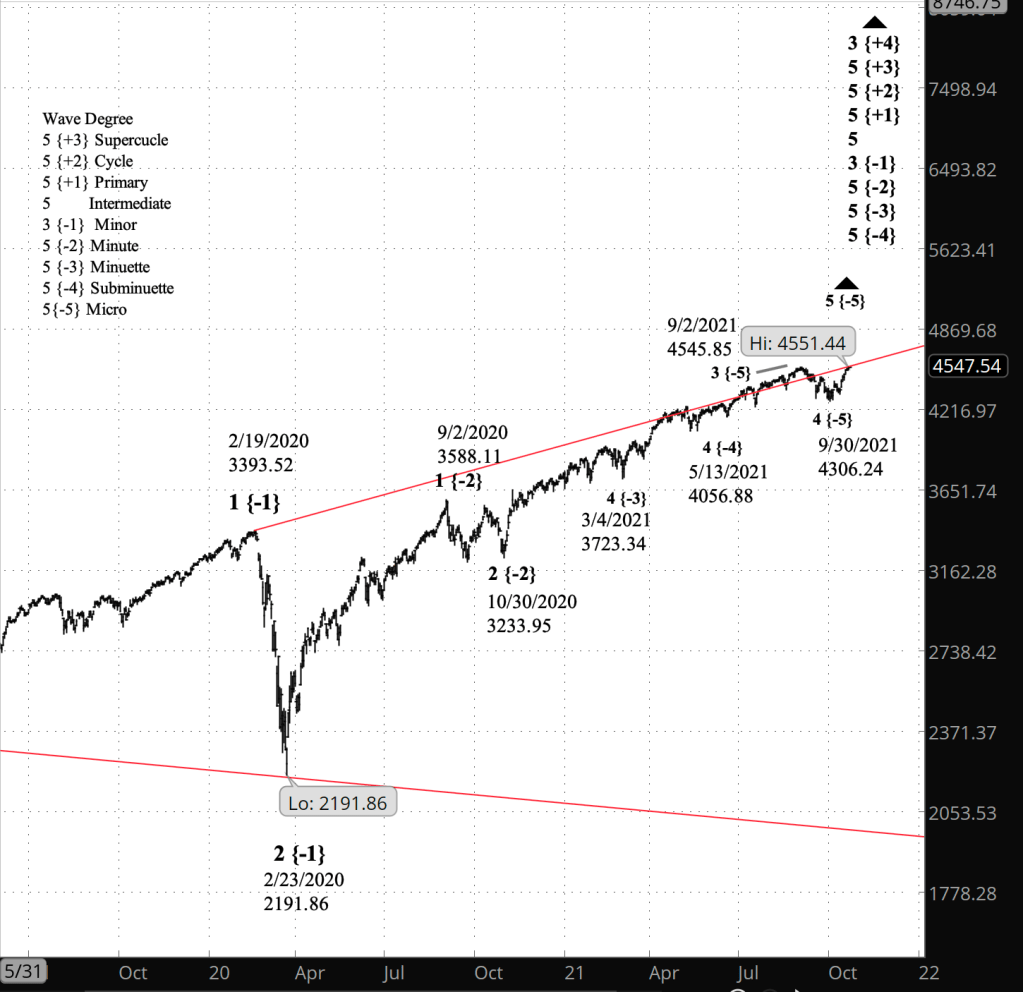
Two charts. The upper chart is a shorter-term chart, showing movement beginning with the September 3 high. The lower chart is a longer-term chart tracing the early pandemic crash and the rise that followed.
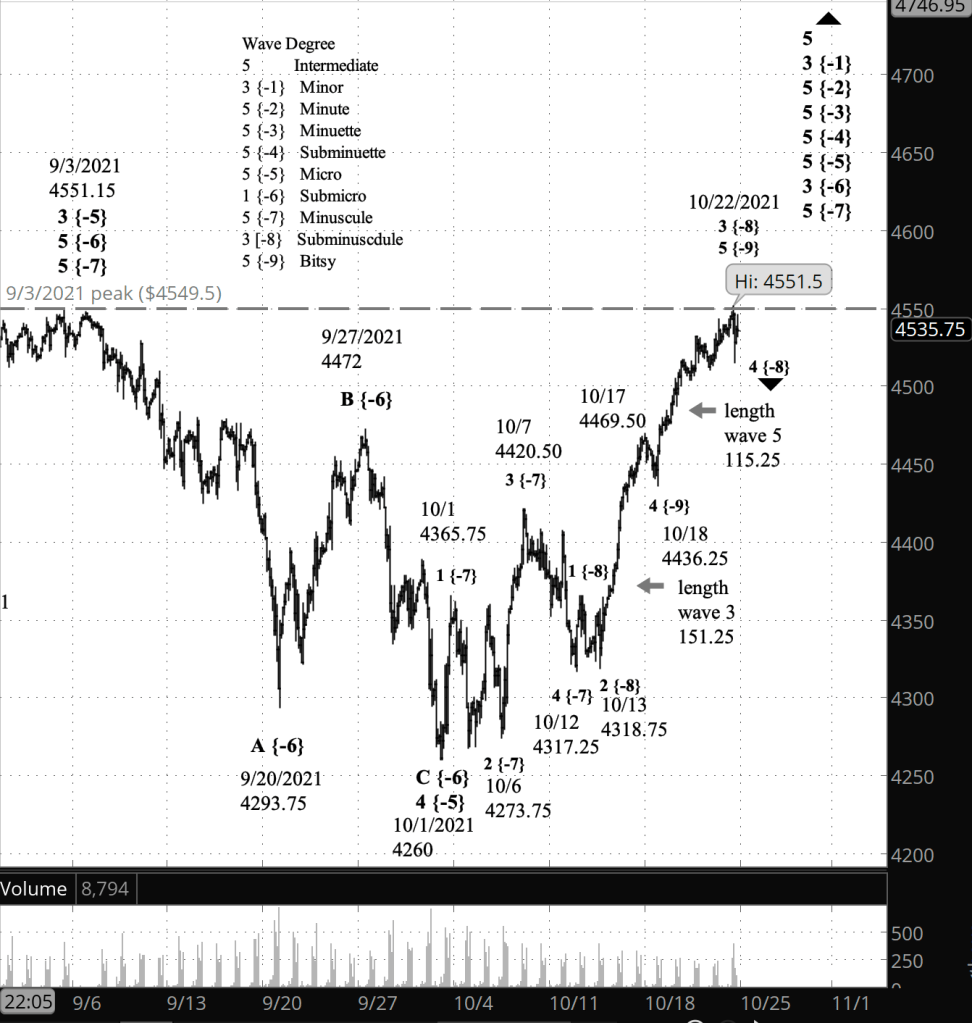
What does Elliott wave theory say? Shorter-term chart: The rise that began October 13 is wave 3 of Subminuscule degree, and internally, it is in its 5th and final wave, of Bitsy degree. Subminuscule 3 is the middle wave within wave 5 of Minuscule degree, which is the final wave within wave 1 of Submicro degree, which began on October 1 from 4260. Submicro 1 will be followed by a sharp downward correction, retracing much of the rise from October 1, and then by a 3rd wave reaching new heights, a shallow 4th wave correction, and a 5th wave, likely going still higher, that will complete the parent wave 4 of Micro degree, which began May 13.
Micro degree is the smallest movement I’ve labelled on the long-term chart. It is the final wave within, in ascending order, 5th waves of Subminuette, Minuette and Minute degrees, and when Minute 5 is complete, it will also mark the end of wave 3 of Minor degree, which began on February 23 from 2191.86, the end of the early pandemic crash.
Longer-term chart: All of that is happening within Intermediate wave 5, which began in December 2018 and is taking the form of an expanding Diagonal Triangle, meaning the price reversal boundaries are moving further apart from each other day by day.
Minor wave 3 will be followed by Minor wave 4, which will carry the price to the lower boundary of the Diagonal Triangle, which is in the 2050s at this point but will be far lower by the time the price reaches it. After Minor wave 4, the price as Minor wave 5 will again return to the upper boundary completing the parent, wave 5 of Intermediate degree, which will be followed by a downward correction of epic proportions.
Learning and other resources. Elliott wave analysis provides context, not prophecy. As the 20th century semanticist Alfred Korzybski put it in his book Science and Sanity (1933), “The map is not the territory … The only usefulness of a map depends on similarity of structure between the empirical world and the map.” And I would add, we can judge that similarity of structure only after the fact.
See the menu page Analytical Methods for a rundown on where to go for information on Elliott wave analysis.
By Tim Bovee, Portland, Oregon, October 22, 2021
Disclaimer
Tim Bovee, Private Trader tracks the analysis and trades of a private trader for his own accounts. Nothing in this blog constitutes a recommendation to buy or sell stocks, options or any other financial instrument. The only purpose of this blog is to provide education and entertainment.
No trader is ever 100 percent successful in his or her trades. Trading in the stock and option markets is risky and uncertain. Each trader must make trading decisions for his or her own account, and take responsibility for the consequences.
License
All content on Tim Bovee, Private Trader by Timothy K. Bovee is licensed under a Creative Commons Attribution-ShareAlike 4.0 International License.
Based on a work at www.timbovee.com.

[…] how much high does the S&P 500 really have? As shown in the longer-term chart that I posted on Friday, the price since April has been bouncing along the upper boundary of the Diagonal Triangle that […]
LikeLike