3:30 p.m. New York time
Half an hour before the closing bell. The futures peak attained earlier in the session remains in place, 4564. The index is a bit higher, at 4572.62. Wave 3 of Subminuscule degree continues its rise.
1:40 p.m. New York time
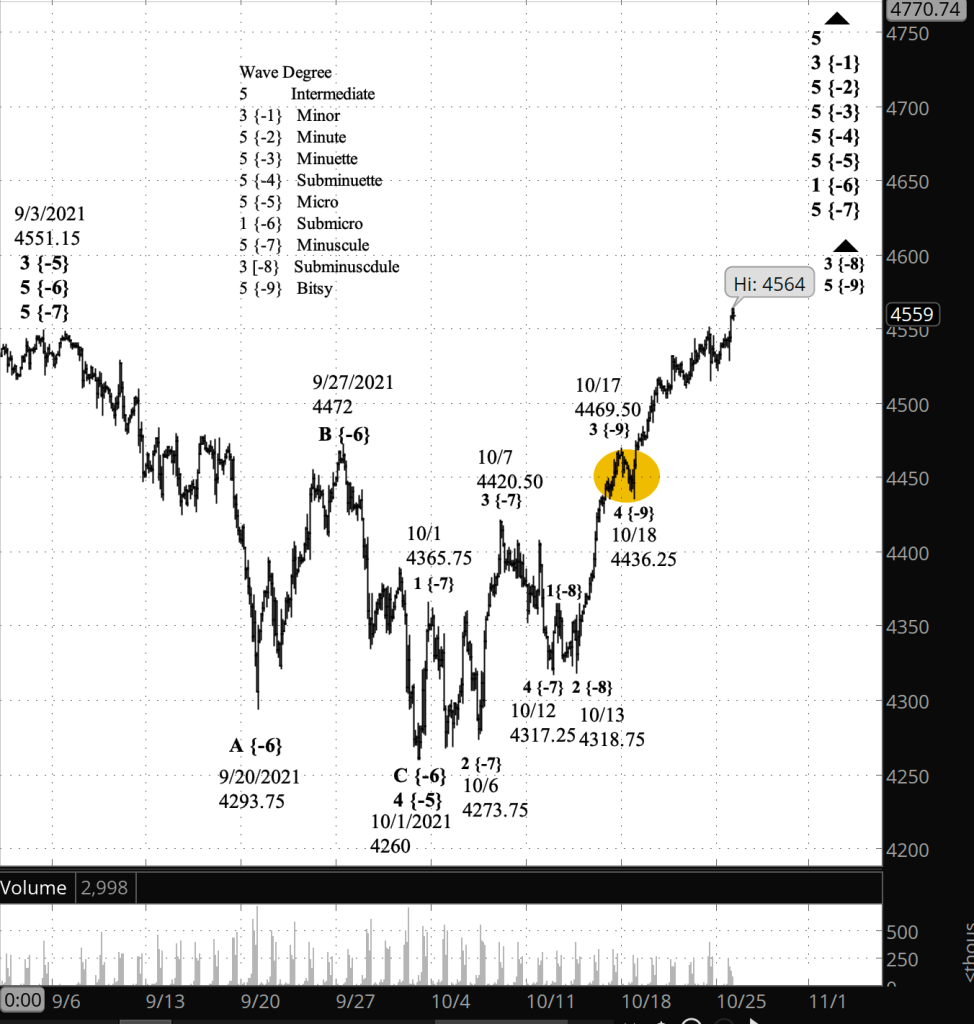
A new peak. The S&P 500 exceeded Friday’s high, setting a peak so far of 4564 on the futures, 4571.98 on the index. This means that the alternative analysis is correct. Wave 3 of Subminuscule degree, which began on October 13, is still underway. I’ve updated the chart.
10:05 a.m. New York time
What’s happening now? The S&P 500 E-mini futures rose in overnight trading to 4548, slightly below Friday’s peak, 4551.50, and then five minutes before the opening bell fell sharply, to 4528.75.
What does it mean? The shallow correction that began with Friday’s peak continues.
What’s the alternative? If the price pushes above above 4551.50, then the correction is over and the uptrend that began October 12 has resumed.
What does Elliott wave theory say? The correction is a 4th wave, and given the small magnitude of the correction so far, I think the movement we’re seeing are subwaves smaller than Bitsy degree, the largest degree within the correction, wave 4 of Subminuscule degree. As I’ve noted before, establishing which degree is being tracked early in the game is a guess at best. The proper degree will become apparent as the market movement continues.
Here’s what Elliott has to say about 4th waves: They alternate in form with 2nd waves; in this case the 2nd wave was a Zigzag, and so this correction is most likely a Flat, or perhaps a Triangle or a combination of forms. A 4th wave is never moves beyond the end of the 1st wave, which was 4365 in this case. A 4th wave generally ends within the 4th subwave of the 3rd wave of the same degree.
In this case, that’s wave 4 of Bitsy degree within wave 3 of Subminuscule degree, which I’ve marked on the chart with a circle. Bitsy wave 4 within the 3rd wave ranges from 4469.50 down to 4436.25, suggesting that the present correction, wave 4 of Subminuscule degree, has 100 points of downside potential, more or less,
Learning and other resources. Elliott wave analysis provides context, not prophecy. As the 20th century semanticist Alfred Korzybski put it in his book Science and Sanity (1933), “The map is not the territory … The only usefulness of a map depends on similarity of structure between the empirical world and the map.” And I would add, we can judge that similarity of structure only after the fact.
See the menu page Analytical Methods for a rundown on where to go for information on Elliott wave analysis.
By Tim Bovee, Portland, Oregon, October 25, 2021
Disclaimer
Tim Bovee, Private Trader tracks the analysis and trades of a private trader for his own accounts. Nothing in this blog constitutes a recommendation to buy or sell stocks, options or any other financial instrument. The only purpose of this blog is to provide education and entertainment.
No trader is ever 100 percent successful in his or her trades. Trading in the stock and option markets is risky and uncertain. Each trader must make trading decisions for his or her own account, and take responsibility for the consequences.
License
All content on Tim Bovee, Private Trader by Timothy K. Bovee is licensed under a Creative Commons Attribution-ShareAlike 4.0 International License.
Based on a work at www.timbovee.com.

You must be logged in to post a comment.