3:30 p.m. New York time
Half an hour before the closing bell. The S&P 500 rose during the trading session, reaching 4584.75 on the futures, 4592.69 on the index, each slightly below the October 26 peak of 4590 on the futures, 4598.53 on the index. No change in the analysis. I’ve updated the chart.
9:40 a.m. New York time
What’s happening now? The S&P 500 E-mini futures reached a low of 4543.75 in overnight trading, down 46 points from the October 26 peak, and then rose slightly in a sideways pattern, remaining below the peak.
What does it mean? The two alternatives I described yesterday remain: Either the decline is a small internal correction as the rise that began October 13 continues. Or the October 26 peak ended that rise, and the subsequent decline is the first small steps in what will be a correction of that rise. I consider the two alternatives to be of equal likelihood. The lower the price goes, the more likely it is that the second alternative is correct. At this point, however, I’ve continued to label the chart with the first alternative.
Other alternatives? It’s possible, although unlikely, that October 26 marked the end of the rise that began on in February 2020, from the end of the early pandemic crash. The end of that rise will be followed by a decline that will eventually carry the price down by more than 2,000 points. This alternative would require a major reworking of the chart analysis since February of last year.
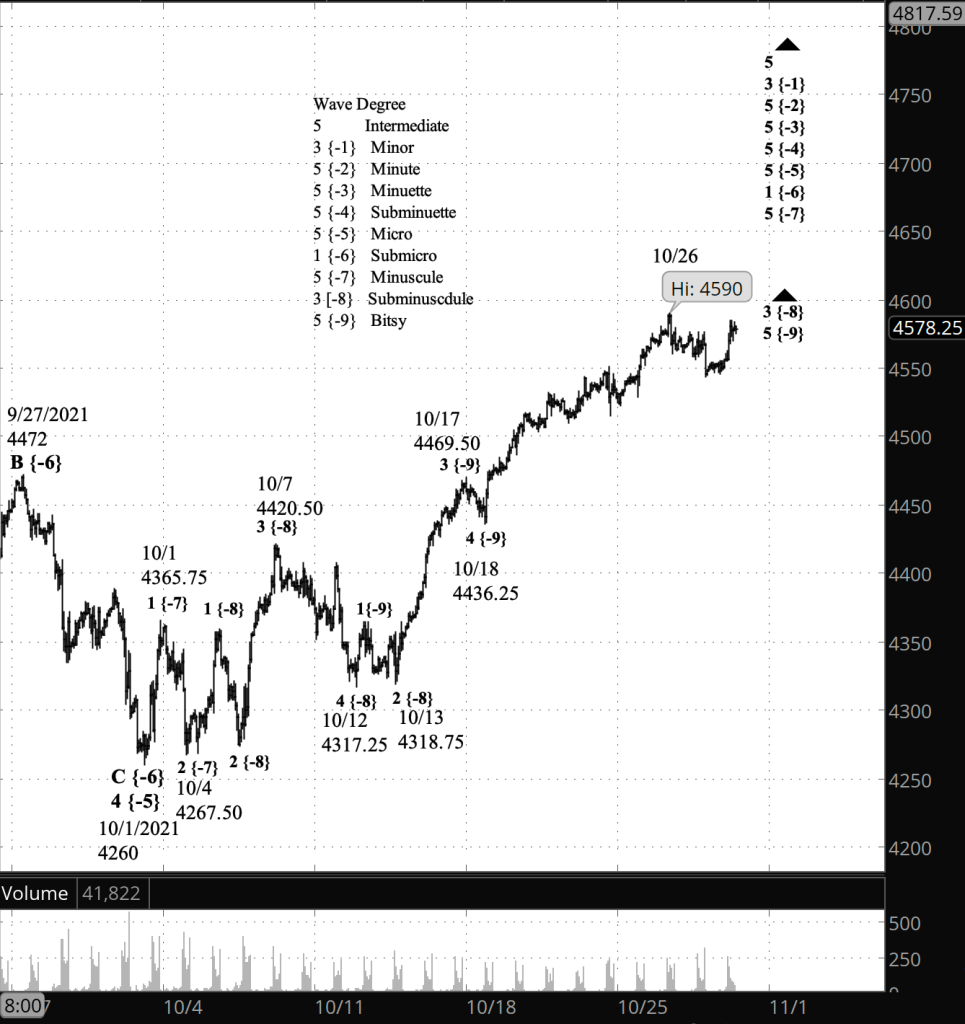
What does Elliott wave theory say? By the first principal count, wave 5 of Bitsy degree within wave 3 of Subminuscule degree continue to rise. By the second principal count, Bitsy 5 within Subminuscule 3 ended on October 26, and wave 4 of Subminuscule degree is underway. Since the preceding 2nd wave of Subminuscule degree was a Zigzag pattern, it is likelh that Subminuscule 4 will be Flat, although there are other options.
Learning and other resources. Elliott wave analysis provides context, not prophecy. As the 20th century semanticist Alfred Korzybski put it in his book Science and Sanity (1933), “The map is not the territory … The only usefulness of a map depends on similarity of structure between the empirical world and the map.” And I would add, we can judge that similarity of structure only after the fact.
See the menu page Analytical Methods for a rundown on where to go for information on Elliott wave analysis.
By Tim Bovee, Portland, Oregon, October 28, 2021
Disclaimer
Tim Bovee, Private Trader tracks the analysis and trades of a private trader for his own accounts. Nothing in this blog constitutes a recommendation to buy or sell stocks, options or any other financial instrument. The only purpose of this blog is to provide education and entertainment.
No trader is ever 100 percent successful in his or her trades. Trading in the stock and option markets is risky and uncertain. Each trader must make trading decisions for his or her own account, and take responsibility for the consequences.
License
All content on Tim Bovee, Private Trader by Timothy K. Bovee is licensed under a Creative Commons Attribution-ShareAlike 4.0 International License.
Based on a work at www.timbovee.com.

You must be logged in to post a comment.