3:30 p.m. New York time
Half an hour before the closing bell. The S&P 500 has dropped back from its new peak as the closing bell approaches. No change in the revised analysis. I’ve updated the charts.
1:35 p.m. New York time
New peak. The S&P 500 has exceeded the October 26 high, confirming that the rise from October 13 is still underway. In Elliott wave terms, that rise is wave 5 of Bitsy degree within wave 3 of Subminuscule degree. So far the peak is 4596.75 on the futures; 4604.11 on the index. Chart updated.
11:20 a.m. New York time
My trades. Today is management day for my short bear call vertical spread position on FXI, 21 days before the options expire. The price rose the day after I entered the position, putting my position in the money and therefore unprofitable. The price peaked on October 22 and since then has fallen back toward profitability. Under my rules, had the position been profitable I would have exited today. It’s not profitable at present, but the price is moving toward profitability. So I’ll continue to hold in the expectation that the price, now at $40.43, will move below the short call strike of $39. One the position is at break-even or better, I’ll exit.
10:20 a.m. New York time
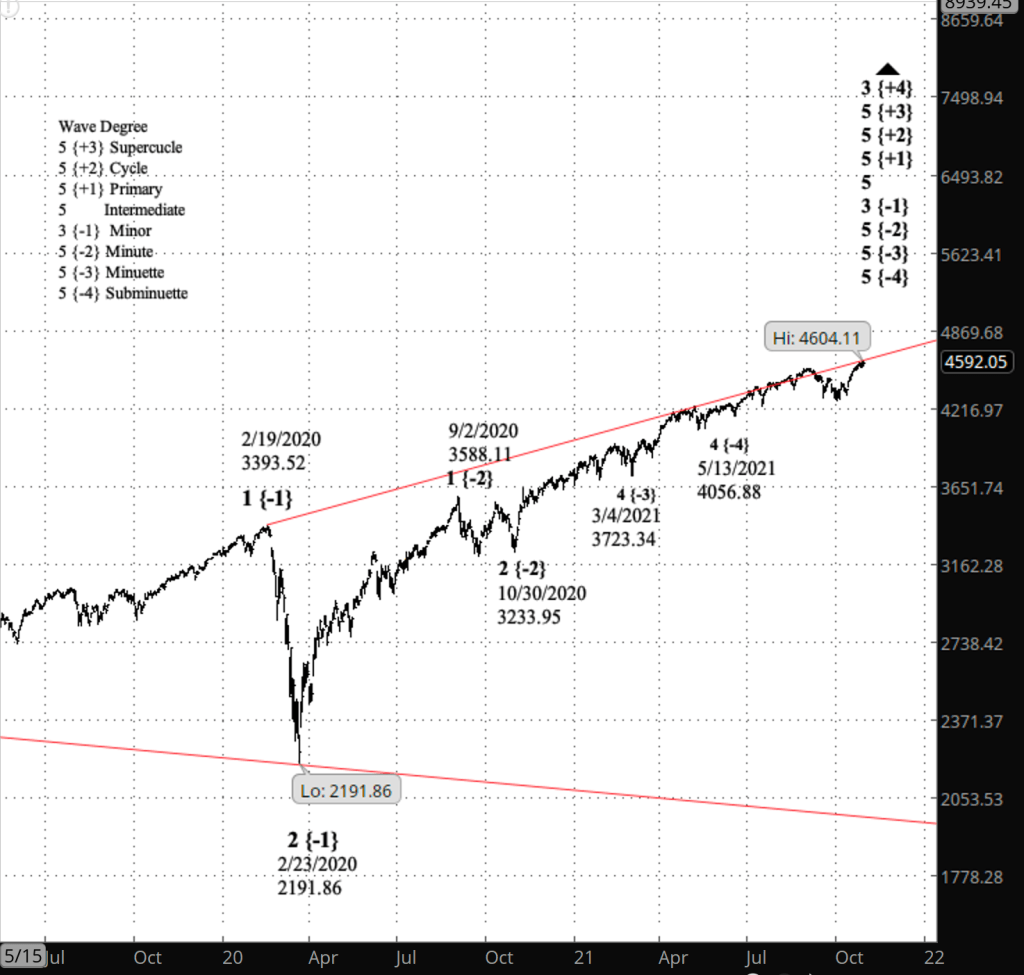
Long-term chart. I’ve added in a longer-term chart of the S&P 500 index, showing the boundaries of the expanding Diagonal Triangle that has been underway since December 2018. It gives perspective to the present market drop, which is a nearly invisible scratch to the right of the 4598.53 peak. The chart is below the shorter-term chart in the original post.
9:35 a.m. New York time
What’s happening now? The S&P 500 E-mini futures continued a shallow sideways movement, remaining below Wednesday’s high as it traced the third leg of the pattern.
What does it mean? The correction appears to be too shallow to be correcting the rise from October 13. A Fibonacci ladder (in red) shows the retracement falls significantly short of a 23.6% Fib retracement.
What’s the alternative? That the retracement is a correction of the rise from October 13. See the Elliott wave theory section below for a discussion.
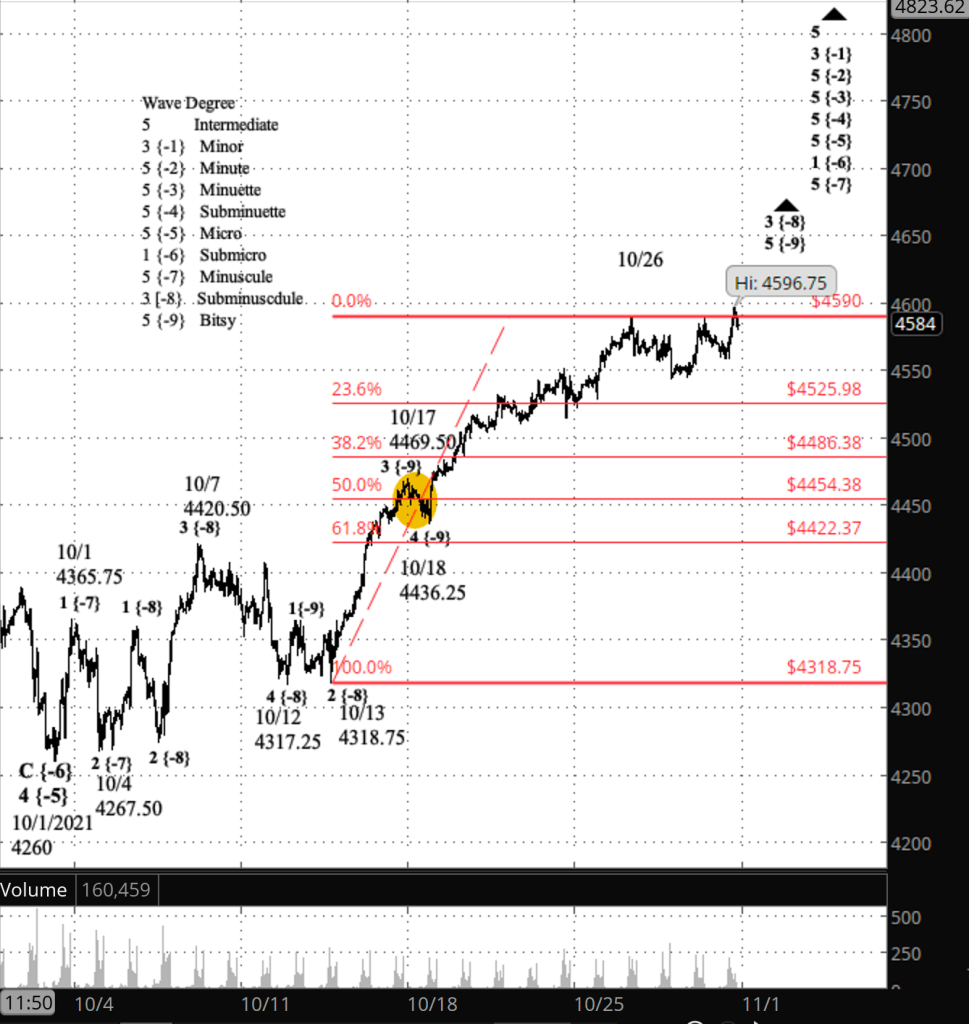
What does Elliott wave theory say? The correction of the rise from October 13, if it’s happening, would be wave 4 of Subminuscule degree. There is no rule in Elliott in Elliott requiring a certain depth of correction in a 4th wave.
The Elliott guidance is that the wave alternate in form from the preceding 2nd wave, which this sideways movement fulfills. The 2nd wave was a Zigzag; this movement is a Flat.
The only guidance as to the depth of the correction is that 4th waves generally end within the 4th wave of the preceding 3rd wave, which I’ve marked with a tan oval on the chart. In this case that would imply a 50% retracement, and the three waves of the present pattern falls well short of that.
Long story short: I’m not sure what a degree of movement we’re seeing. As always, the ambiguity will resolve itself, either with the price falling to a level appropriate for a correction of this degree, or the price rising above 4590, the high of October 26, which would demonstrate that the uptrending wave 5 of Bitsy degree within wave 3 of Subminuscule degree is still underway.
Learning and other resources. Elliott wave analysis provides context, not prophecy. As the 20th century semanticist Alfred Korzybski put it in his book Science and Sanity (1933), “The map is not the territory … The only usefulness of a map depends on similarity of structure between the empirical world and the map.” And I would add, we can judge that similarity of structure only after the fact.
See the menu page Analytical Methods for a rundown on where to go for information on Elliott wave analysis.
By Tim Bovee, Portland, Oregon, October 29, 2021
Disclaimer
Tim Bovee, Private Trader tracks the analysis and trades of a private trader for his own accounts. Nothing in this blog constitutes a recommendation to buy or sell stocks, options or any other financial instrument. The only purpose of this blog is to provide education and entertainment.
No trader is ever 100 percent successful in his or her trades. Trading in the stock and option markets is risky and uncertain. Each trader must make trading decisions for his or her own account, and take responsibility for the consequences.
License
All content on Tim Bovee, Private Trader by Timothy K. Bovee is licensed under a Creative Commons Attribution-ShareAlike 4.0 International License.
Based on a work at www.timbovee.com.

You must be logged in to post a comment.