3:25 p.m. New York time
Thirty-five minutes before the closing bell. The high set in overnight trading has prove to be the high (so far) of the day. The S&P 500 fell thereafter, so far reaching a low of 4586.50. The decline could be the end of the 3rd wave of Subbitsy degree within wave 5 of Bitsy degree. Or it could be a subwave of the 1st wave of Subbitsy degree. In either case, the corrective decline will be followed by a rise to new heights. No change in the analysis. I’ve updated the chart.
9:35 a.m. New York time
What’s happening now? The S&P 500 E-mini futures continued to rise when trading resumed overnight, so far reaching 4619.50.
What does it mean? The uptrend that began October 12 is still underway and in the middle section of its rise. Internally, it is in its final section, which in turn is in its middle section. (A trend has three movements in the direction of the trend.)
What’s the alternative? There is no strict upper limit to the rise, beyond the need to be proportional to the size of the overall movement and to more or less adhere to the price channels and triangle boundaries. The S&P 500 has been working its away along the upper boundary of an expanding Diagonal Triangle that began in December 2018. This provides a very loose limit to how high the trend can go.
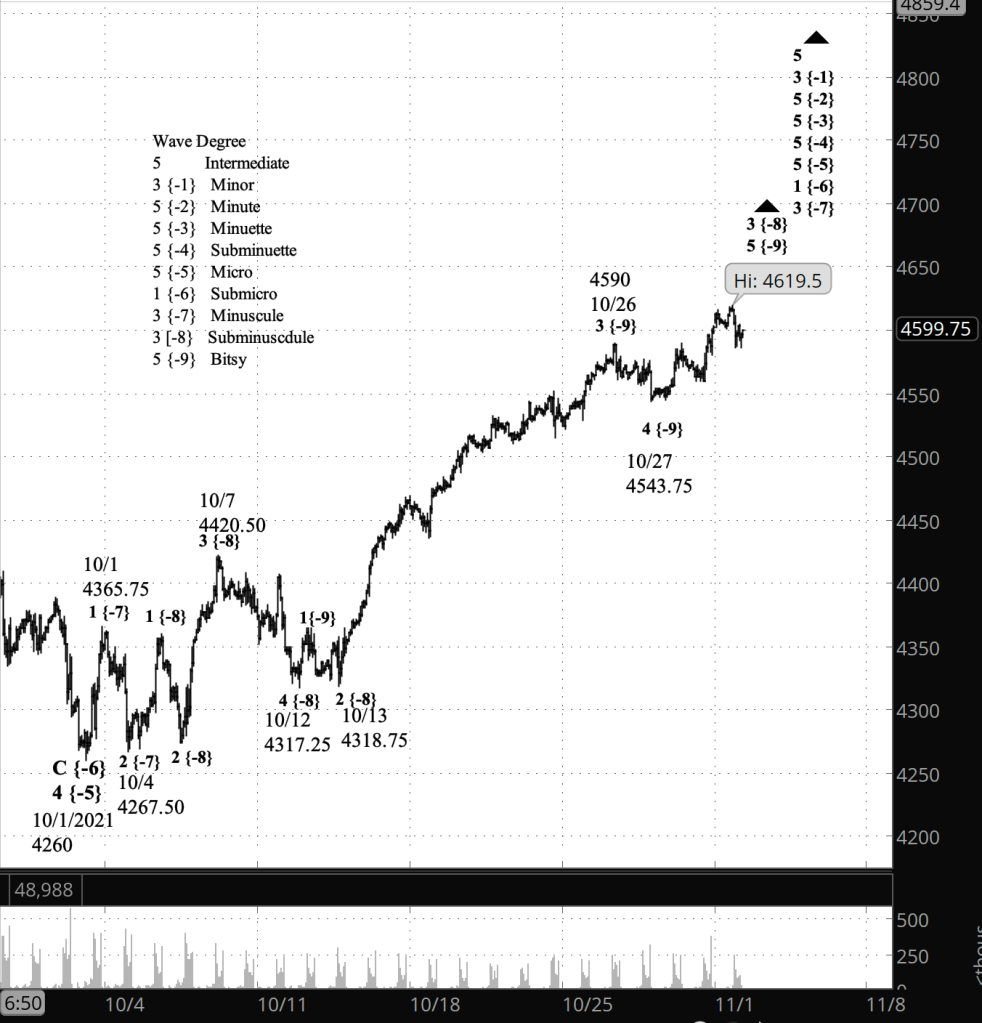
What does Elliott wave theory say? The present rise is wave 5 of Bitsy degree within wave 5 of Subminuscule degree within wave 3 of Minuscule degree, which began on October 4 from 4267.50. Within Bitsy wave 5, at the Subbitsy degree, the 3rd wave is underway.
Subminuscule wave 5, when complete, will mark the end of its parent, Minuscule wave 3, which will be followed by a shallow correction, Minuscule wave 4, that in turn will be followed by a move to new highs by as Minuscule wave 5.
Learning and other resources. Elliott wave analysis provides context, not prophecy. As the 20th century semanticist Alfred Korzybski put it in his book Science and Sanity (1933), “The map is not the territory … The only usefulness of a map depends on similarity of structure between the empirical world and the map.” And I would add, we can judge that similarity of structure only after the fact.
See the menu page Analytical Methods for a rundown on where to go for information on Elliott wave analysis.
By Tim Bovee, Portland, Oregon, November 1, 2021
Disclaimer
Tim Bovee, Private Trader tracks the analysis and trades of a private trader for his own accounts. Nothing in this blog constitutes a recommendation to buy or sell stocks, options or any other financial instrument. The only purpose of this blog is to provide education and entertainment.
No trader is ever 100 percent successful in his or her trades. Trading in the stock and option markets is risky and uncertain. Each trader must make trading decisions for his or her own account, and take responsibility for the consequences.
License
All content on Tim Bovee, Private Trader by Timothy K. Bovee is licensed under a Creative Commons Attribution-ShareAlike 4.0 International License.
Based on a work at www.timbovee.com.

You must be logged in to post a comment.