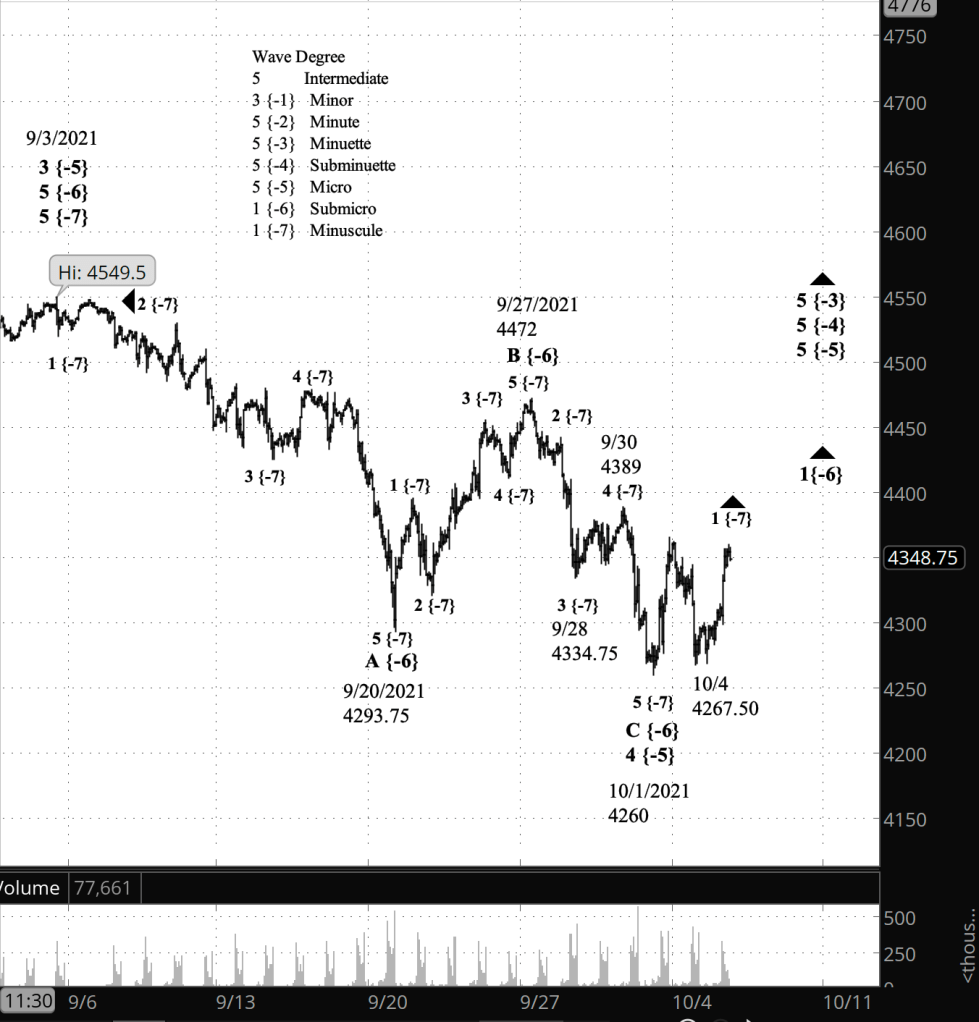
3:30 p.m. New York time
Half an hour before the closing bell. The S&P 500 reversed direction and resumed its climb while remaining below the two prior peaks since the low that ended wave 4 of Micro degree on October 1. No change in the analysis. I’ve updated the chart, labeling the overnight low as the end of wave 2 of Minuscule degree.
11:15 a.m. New York time
My trades. I’ve entered a bear call options spread on FXI. I’ve exited my position on PAAS for a loss.
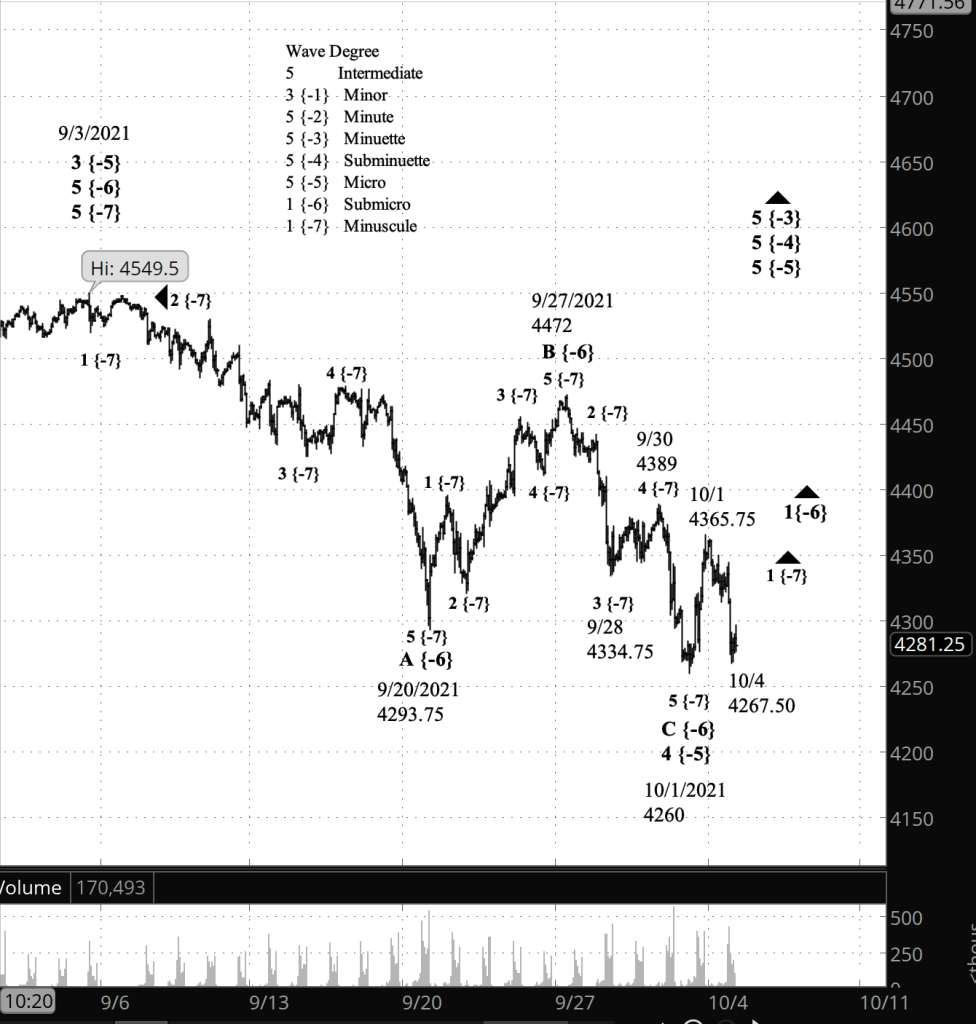
9:35 a.m. New York time
What’s happening now? The S&P 500 E-mini futures declined sharply in overnight trading, remaining above 4260, the low of October 1 that ended the decline that began on September 3.
What does it mean? The decline is the third leg of a low-level correction within the rise that began on October 1.
What’s the alternative? If the price should move below 4260, then something else is going on, such as the decline that began September 3 not yet being complete.

What does Elliott wave theory say? By my principle analysis, the low of 4260 on October 1 ended wave 4 of Micro degree. The subsequent rise was wave 1 of Minuscule degree within wave 5 of Micro degree, the decline that followed is wave 2 of Minuscule degree. That 2nd wave correction has so far reached a low of 4267.50, on October 4, just 7-1/2 points above the end of wave 4 of Micro degree. A fall below the end of that 4th wave would suggest that the correction is still underway. On the chart I’ve marked wave 2 of Minuscule degree as still being underway. However, it’s possible that wave 2 ended at the October 4 low, and the second low in overnight trading wave 2 of Subminuscule degree within wave 3 of Minuscule degree. As always, the degrees are ambiguous — the market provides no “You Are Here” signs.
Learning and other resources. Elliott wave analysis provides context, not prophecy. As the 20th century semanticist Alfred Korzybski put it in his book Science and Sanity (1933), “The map is not the territory … The only usefulness of a map depends on similarity of structure between the empirical world and the map.” And I would add, we can judge that similarity of structure only after the fact.
See the menu page Analytical Methods for a rundown on where to go for information on Elliott wave analysis.
By Tim Bovee, Portland, Oregon, October 6, 2021
Disclaimer
Tim Bovee, Private Trader tracks the analysis and trades of a private trader for his own accounts. Nothing in this blog constitutes a recommendation to buy or sell stocks, options or any other financial instrument. The only purpose of this blog is to provide education and entertainment.
No trader is ever 100 percent successful in his or her trades. Trading in the stock and option markets is risky and uncertain. Each trader must make trading decisions for his or her own account, and take responsibility for the consequences.
License
All content on Tim Bovee, Private Trader by Timothy K. Bovee is licensed under a Creative Commons Attribution-ShareAlike 4.0 International License.
Based on a work at www.timbovee.com.


You must be logged in to post a comment.