3:30 p.m, New York time
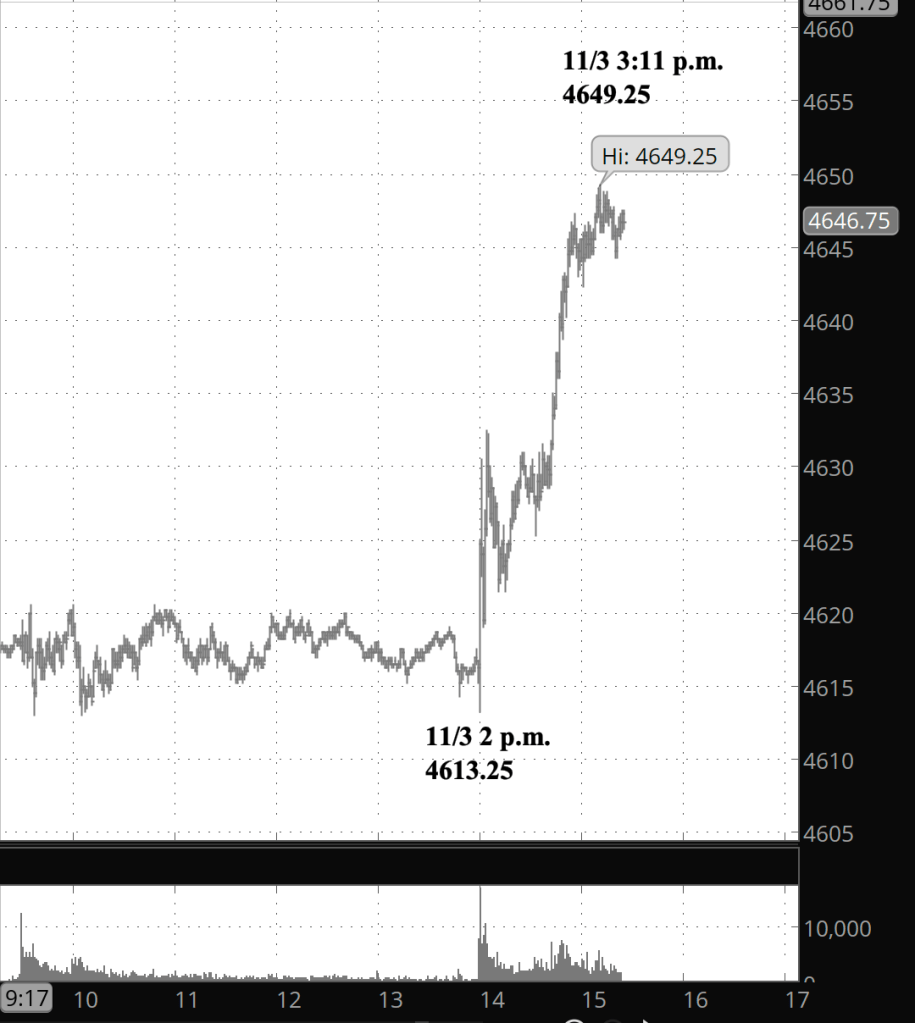
Half an hour before the closing bell. The S&P 500 began to climb immediately upon the release of the Federal Open Market Committee statement on monetary policy. The futures rose by 36 points in 71 minutes, from 4613.25 to 4649.25 and at present has fallen back a little in a correction of very low degree. In terms of the analysis, the low degree correction within wave 5 of Bitsy degree is over and the price is again trending upward.
I’ve added a very near term chart showing the rise and updated the longer term chart from this morning.
9:35 a.m. New York time
What’s happening now? The S&P 500 moved sideways in overnight trading, for the most part staying within 10 points of yesterday’s high of 4627 on the futures, 4635.15 on the index.
What does it mean? The movement can be interpreted as the second correction within the rise that began on October 27. Typically such corrections are shallow, without much in the way of drama.
What’s the alternative? The placement of the fluctuations within the rise from late October are open to interpretation. Is the present correction one level down from the top level of the rise? Two levels down? The answer as an impact mainly on the timing of future movements.
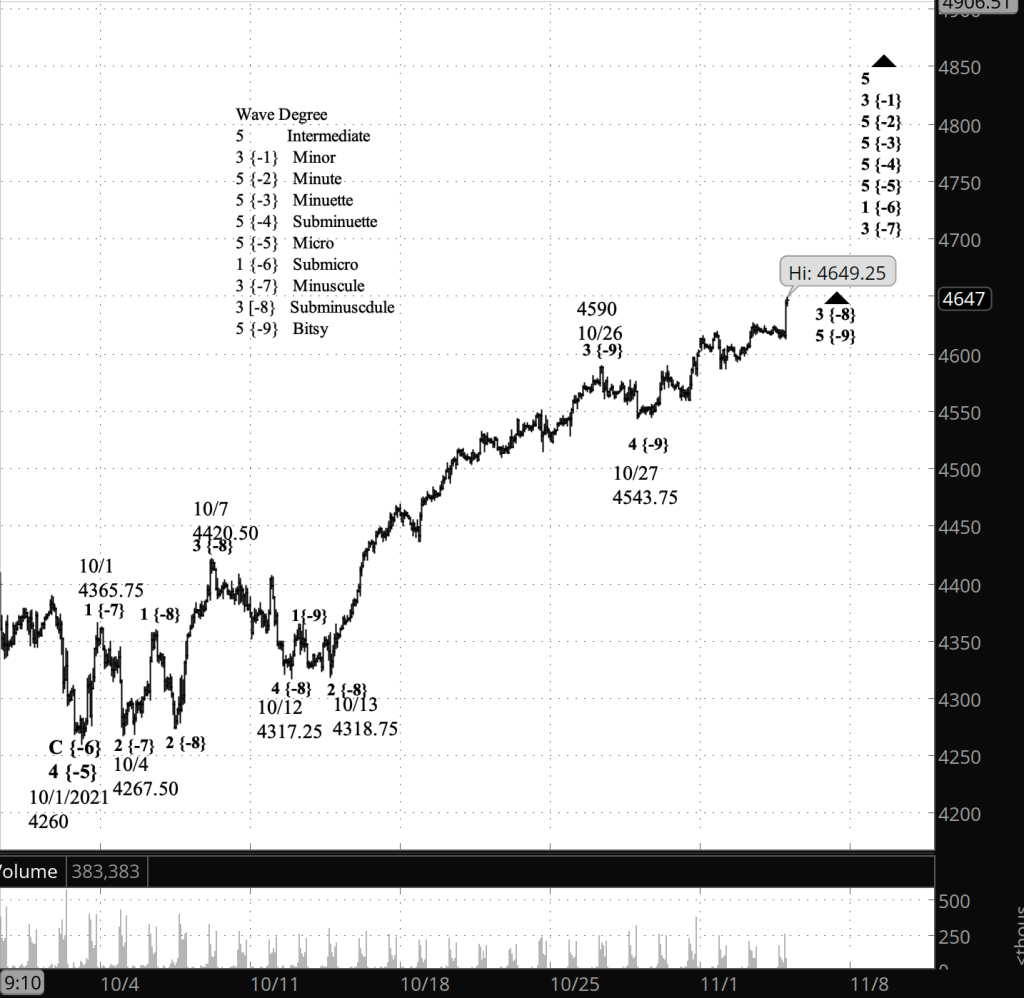
What does Elliott wave theory say? My analysis yesterday labeled the movement as down one degree, to the Subbitsy degree, from the parent wave 5 of Bitsy degree. It’s also possible that the degree is below the Subbitsy level. In any case, the end of the parent wave, the 5th of Bitsy degree, will mark the end of the parent wave 3 of Subminuscule degree and the beginning of a 4th wave correction, most likely a shallow Flat pattern, as 4th waves tend to be. It will be followed by a rise to new highs.
Learning and other resources. Elliott wave analysis provides context, not prophecy. As the 20th century semanticist Alfred Korzybski put it in his book Science and Sanity (1933), “The map is not the territory … The only usefulness of a map depends on similarity of structure between the empirical world and the map.” And I would add, we can judge that similarity of structure only after the fact.
See the menu page Analytical Methods for a rundown on where to go for information on Elliott wave analysis.
By Tim Bovee, Portland, Oregon, November 3, 2021
Disclaimer
Tim Bovee, Private Trader tracks the analysis and trades of a private trader for his own accounts. Nothing in this blog constitutes a recommendation to buy or sell stocks, options or any other financial instrument. The only purpose of this blog is to provide education and entertainment.
No trader is ever 100 percent successful in his or her trades. Trading in the stock and option markets is risky and uncertain. Each trader must make trading decisions for his or her own account, and take responsibility for the consequences.
License
All content on Tim Bovee, Private Trader by Timothy K. Bovee is licensed under a Creative Commons Attribution-ShareAlike 4.0 International License.
Based on a work at www.timbovee.com.

You must be logged in to post a comment.