3:30 p.m. New York time
Half an hour before the opening bell. The S&P 500 moved to higher peak 40 minutes after the opening bell, to 4674.75 on the futures, 4683 on the index. Thereafter the price has so far traded in a narrow range. No change in the analysis. I’ve updated the chart.
9:35 a.m. New York time
What’s happening now? The S&P 500 E-mini futures attained a new high in overnight trading, 4662.50. The greater part of the rise that began with yesterday’s Federal Open Market Committee statement was complete by yesterday evening, and today’s early morning peak came during a sideways movement.
What does it mean? The price has met all of the requirements for completion of the rise that began on October 27 from 4543.75. However, there’s also no barrier to the rise continuing. I’ll discuss the matter further in the Elliott wave theory section. If the rise is complete, the next movement will be a 4th wave correction of the rise from late October.
What’s the alternative? As noted above, there’s ambiguity in whether the rise has further to go. There’s also ambiguity as to the degree — the size — of the rise. Does the end of the present rise mean the end of the rise that began on October 13? Or is it a lower level rise within a parent wave that has much further to go before reaching completion?
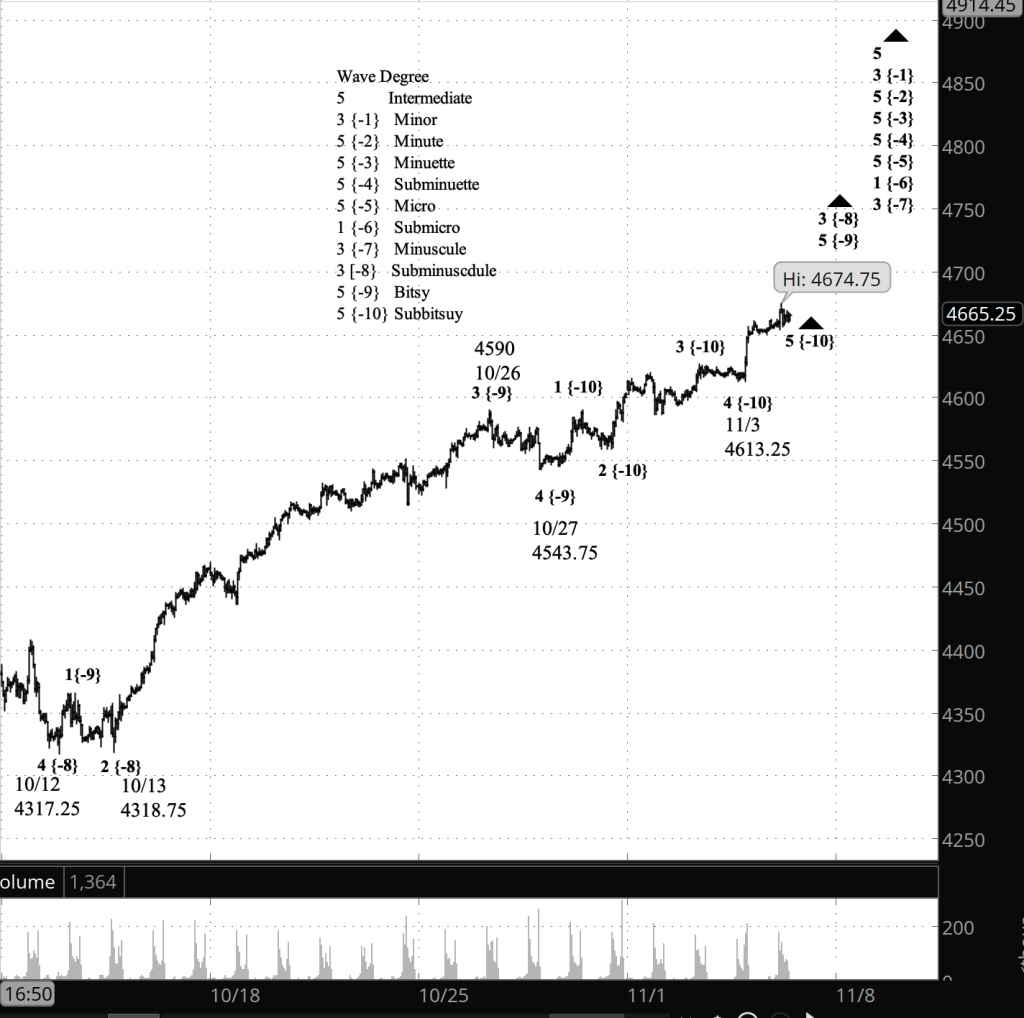
What does Elliott wave theory say? The rise from October 27 is wave 5 of Bitsy degree within wave 3 of Subminuscule degree, which began October 13 from 4318.75. Internally, Bitsy wave is in its 5th and final wave, of Subbitsy degree.
In Elliott, there is no limit to how high a 5th wave can go, nor any barrier to it being over with only a small rise.
On the chart, I’ve labeled the rise from October 27 as being of Subbitsy degree, but it’s possible that it could be a degree or even two degrees smaller, a 1st wave of Subbitsy degree. This would magnify the amount of upside we can expect.
In any case, the end of Subbitsy 5 also marks the end of Bitsy wave 5 and Subminuscule wave 3, and will be followed by a 4th wave correction of Subminuscule degree.
Learning and other resources. Elliott wave analysis provides context, not prophecy. As the 20th century semanticist Alfred Korzybski put it in his book Science and Sanity (1933), “The map is not the territory … The only usefulness of a map depends on similarity of structure between the empirical world and the map.” And I would add, we can judge that similarity of structure only after the fact.
See the menu page Analytical Methods for a rundown on where to go for information on Elliott wave analysis.
By Tim Bovee, Portland, Oregon, November 4, 2021
Disclaimer
Tim Bovee, Private Trader tracks the analysis and trades of a private trader for his own accounts. Nothing in this blog constitutes a recommendation to buy or sell stocks, options or any other financial instrument. The only purpose of this blog is to provide education and entertainment.
No trader is ever 100 percent successful in his or her trades. Trading in the stock and option markets is risky and uncertain. Each trader must make trading decisions for his or her own account, and take responsibility for the consequences.
License
All content on Tim Bovee, Private Trader by Timothy K. Bovee is licensed under a Creative Commons Attribution-ShareAlike 4.0 International License.
Based on a work at www.timbovee.com.

You must be logged in to post a comment.