3:30 p.m. New York time
Half an hour before the closing bell. The S&P 500 has remained below Friday’s peak so far in the trading session. The price has traced three waves down, three waves up, and now has entered the last leg, which should have five waves internally. The problem with this analysis is that the price is barely 10 points below the peak, and the more likely target would bee around 100 points below the peak. There’s something happening here, but what it is isn’t exactly clear. I’ll retain my present count, that wave 3 of Subminuscule degree is still rising, until the chart regains its clarity.
9:35 a.m. New York time
What’s happening now? The S&P 500 E-mini futures moved up in overnight trading, so far remaining below Friday’s peak of 4711.75.
What does it mean? The rise could be a resumption of the uptrend that began November 3 and could lead to new heights.
What’s the alternative? Or the rise could be a small upward correction in a downtrend that began from the peak of November 5.
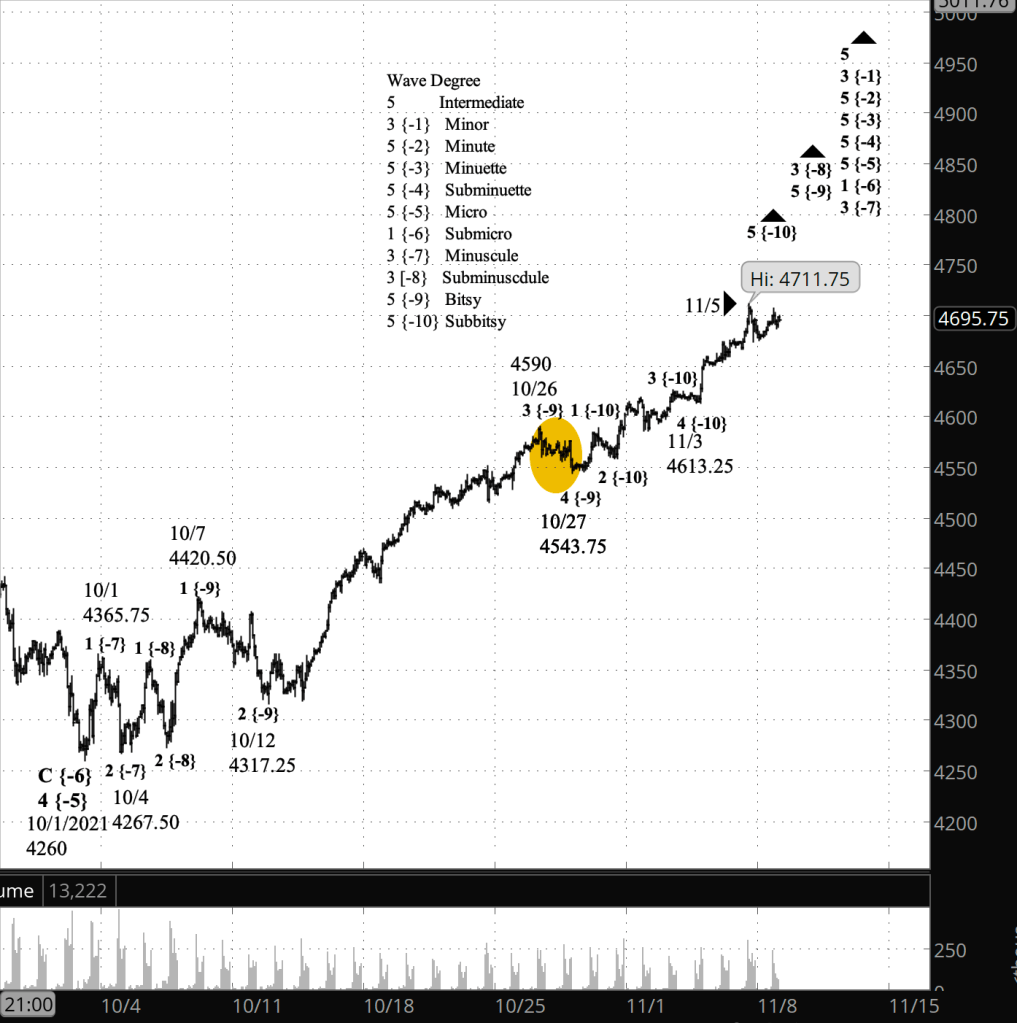
What does Elliott wave theory say? Under my principal analysis, wave 5 of Subbitsy degree within wave 5 of Bitsy degree within wave 3 of Subminuscule degree remains underway.
Under my alternative analysis, Subbitsy 5, Bitsy 5 and Subminuscule 3 ended at Friday’s peak, and the present wave is Subbitsy A within Bitsy A within Subminuscule 4, a correction that will most likely take the form of a Flat.
At this point, in my view, both analyses have an equal chance of playing out.
If Subminuscule 4 is a Flat, it’s likely target range is the boundaries of wave 4 of Bitsy degree within the preceding wave 3 of Subminuscule degree, ranging from 4543.75 up to 4590. I’ve marked that wave with a tan oval on the chart.
Learning and other resources. Elliott wave analysis provides context, not prophecy. As the 20th century semanticist Alfred Korzybski put it in his book Science and Sanity (1933), “The map is not the territory … The only usefulness of a map depends on similarity of structure between the empirical world and the map.” And I would add, we can judge that similarity of structure only after the fact.
See the menu page Analytical Methods for a rundown on where to go for information on Elliott wave analysis.
By Tim Bovee, Portland, Oregon, November 8, 2021
Disclaimer
Tim Bovee, Private Trader tracks the analysis and trades of a private trader for his own accounts. Nothing in this blog constitutes a recommendation to buy or sell stocks, options or any other financial instrument. The only purpose of this blog is to provide education and entertainment.
No trader is ever 100 percent successful in his or her trades. Trading in the stock and option markets is risky and uncertain. Each trader must make trading decisions for his or her own account, and take responsibility for the consequences.
License
All content on Tim Bovee, Private Trader by Timothy K. Bovee is licensed under a Creative Commons Attribution-ShareAlike 4.0 International License.
Based on a work at www.timbovee.com.

You must be logged in to post a comment.