3:30 p.m. New York time
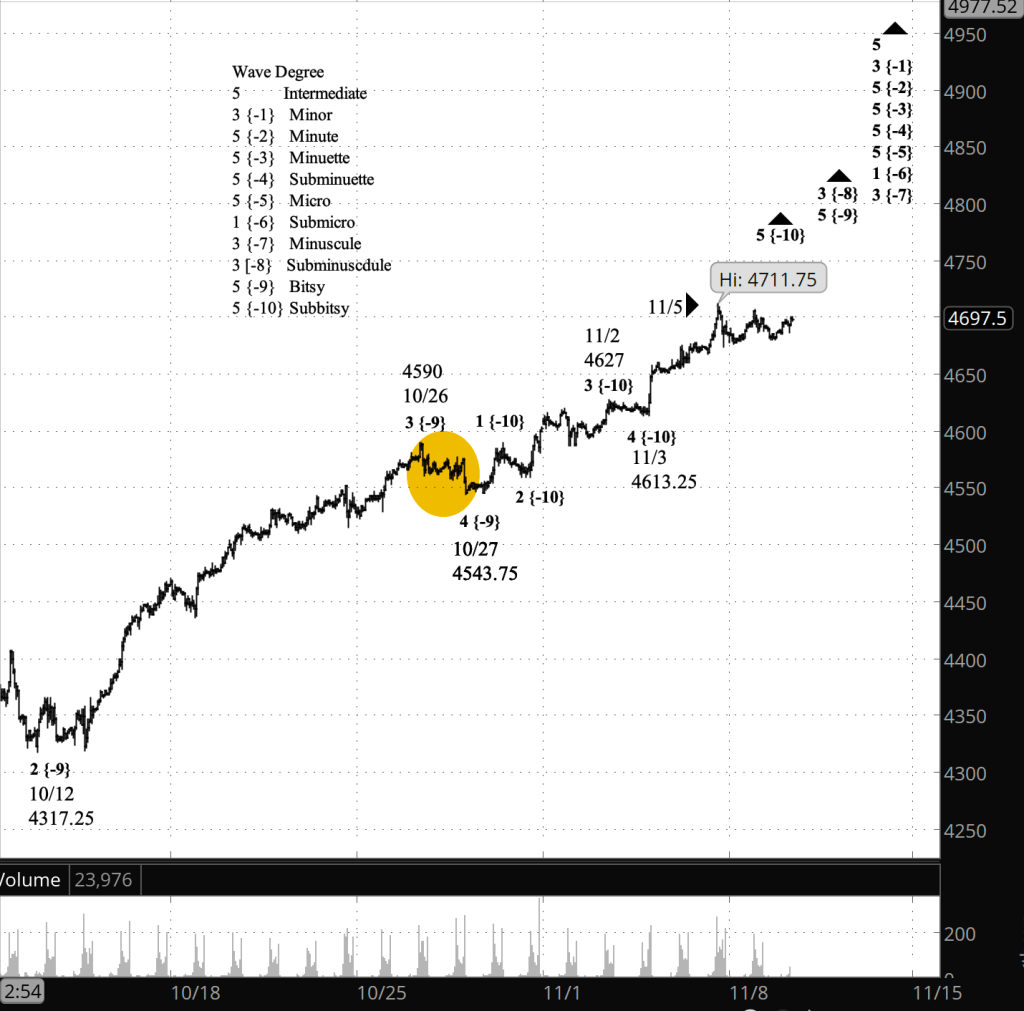
Half an hour before the closing bell. The S&P 500 decline below the sideways movement that has defined it since the November 5 peak. The decline adds a bit of weight to the idea that November 5 marks the end of wave 3 of Subminscule degree, and that the 4th wave has begun. The 4th wave target range, discussed below, remains valid. I’ve added a new chart with the revised mark-up, leaving this morning’s chart with the old mark-up for comparison.
What I’ve marked after November 5 as waves 1 , 2 and 3 with a {-10} subscript, indicating Subbitsy degree, may well be a or two below Subbitsy. The chart will gain clarity as the post-November 5 decline develops.
1:35 p.m. New York time
My trades. Today is the last day under my rules to enter an options spread position using contracts that expire December 17. The ambiguity that I see in the S&P 500 also exists in various forms in my prospective trades. So I’ll be trading simple long calls and puts, and shares, until the entry period for options expiring January 21. Entry runs from November 30 to December 14, with December 7 being the optimal date.
Meanwhile, my short bear call spread on FXI is slightly above the profit zone. It expires next week on Friday, and ideally I’ll be out of the position before the end of this week, for a profit or a small loss.
9:35 a.m. New York time
What’s happening now? The S&P 500 E-mini futures continued to move sideways, having completed three waves and embarked on a fourth.
What does it mean? If the price moves above the November 5 peak, 4711.75, then the correction is over and the uptrend has resumed.
What’s the alternative? If the price remains below 4711.75, then the chart is ensnared in a great deal of ambiguity. The correction seems too shallow to be at the level of the rise that began on October 27, or even down one level from that. I discuss the targets in the Elliott wave theory section below.
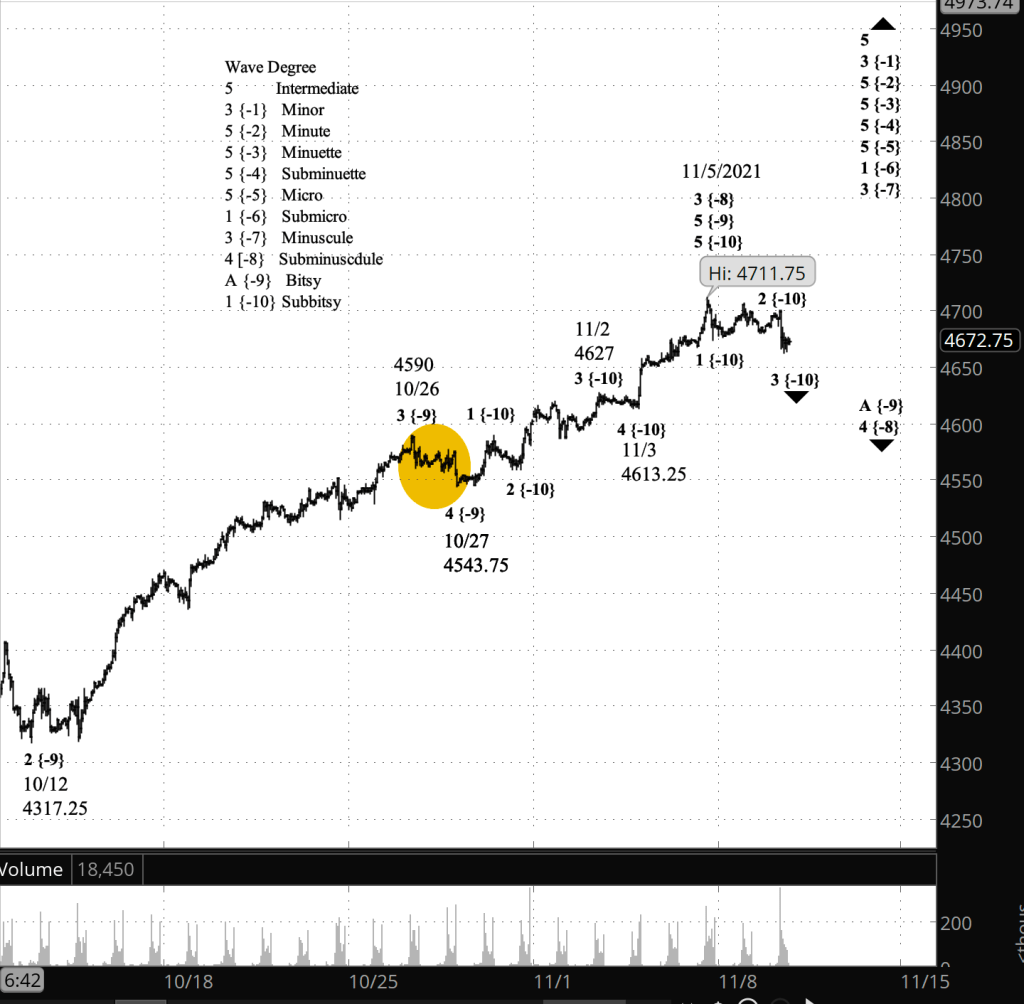
(The chart below is the old mark-up from this morning, which has the rise still underway. The chart above, posted shortly before the closing bell, shows the revised mark-up with the rise ending on November 5.)
What does Elliott wave theory say? The S&P 500 is present in wave 5 of Subbitsy degree within wave 5 of Bitsy degree within wave 3 of Subminuscule degree. The sideways movement beginning November 5 is a 4th wave correction within wave 5 of Subbitsy degree.
A 4th wave differs in form from the prior 2nd wave of the same degree. That is, if wave 2 is a Zigzag, then wave 4 will most likely be a Flat. And indeed, within wave 3 of Subminuscule degree, Bitsy wave 2 was a Zigzag and so the 4th wave correction most likely will be a Flat or a Triangle.
If a 4th wave correction takes the form of a Flat, it tends to reach down into the range 4th wave one degree lower within the preceding 3rd wave. In this case, if wave 4 of Subminuscule degree has begun, it should reach down to the range of wave 4 of Bitsy degree within wave 3 of Subminuscule degree. I’ve marked that 3rd wave on the chart with a tan circle. The range is 4543.75 up to 4590.
The present sideways pattern at its lowest is 80 points above the target range. And so, is the correction a 4th wave of Subminuscule degree, or of some lower degree.
The target range is a tendency, not a firm expectation. So this extremely shallow correction could be wave 4 of Subminuscule degree. But it’s not a certainty, and I’ve refrained from labelling it that way on the chart.
The ambiguity can be resolved either by the price exceeding the November 5 peak, meaning that wave 3 of Subminuscule degree is still underway, or by the price declining to within, or at least close to, the range marked by the tan circle, which would mean that wave 4 of Subminuscule degree began on November 5.
Give the low degree of the conundrum, I expect a resolution of the question within days, a week or so at the longest. That’s a guess, not a guarantee.
Learning and other resources. Elliott wave analysis provides context, not prophecy. As the 20th century semanticist Alfred Korzybski put it in his book Science and Sanity (1933), “The map is not the territory … The only usefulness of a map depends on similarity of structure between the empirical world and the map.” And I would add, we can judge that similarity of structure only after the fact.
See the menu page Analytical Methods for a rundown on where to go for information on Elliott wave analysis.
By Tim Bovee, Portland, Oregon, November 9, 2021
Disclaimer
Tim Bovee, Private Trader tracks the analysis and trades of a private trader for his own accounts. Nothing in this blog constitutes a recommendation to buy or sell stocks, options or any other financial instrument. The only purpose of this blog is to provide education and entertainment.
No trader is ever 100 percent successful in his or her trades. Trading in the stock and option markets is risky and uncertain. Each trader must make trading decisions for his or her own account, and take responsibility for the consequences.
License
All content on Tim Bovee, Private Trader by Timothy K. Bovee is licensed under a Creative Commons Attribution-ShareAlike 4.0 International License.
Based on a work at www.timbovee.com.

You must be logged in to post a comment.