3:30 p.m. New York time
Half an hour before the closing bell. The S&P 500 fell sharply beginning shortly before noon and has so far reached a low of 4625.25, putting it within 35 points of the target range: Wave 4 of Bitsy degree within wave 3 of Subminuette degree, stretching from 4590 down to 4543.75. No change in the analysis. Wave 4 of Subminuette degree continues. I’ve updated the chart.
9:35 a.m. New York time
What’s happening now? The S&P 500 E-mini futures continued their decline in overnight trading, reaching a low of 4656.75.
What does it mean? The correction that began on November 5 has a target in the 4590 down to 4543.75 range. The low puts the price 67 points above the target’s upper boundary. The lower the price descends, the more likely this principal count is correct. The target is marked on the chart by a tan circle.
What’s the alternative? It’s possible that November 5 wasn’t the end of the rise that began October 12 and that the correction we’re seeing is at a smaller level. The further down the price goes, the less likely this scenario is.
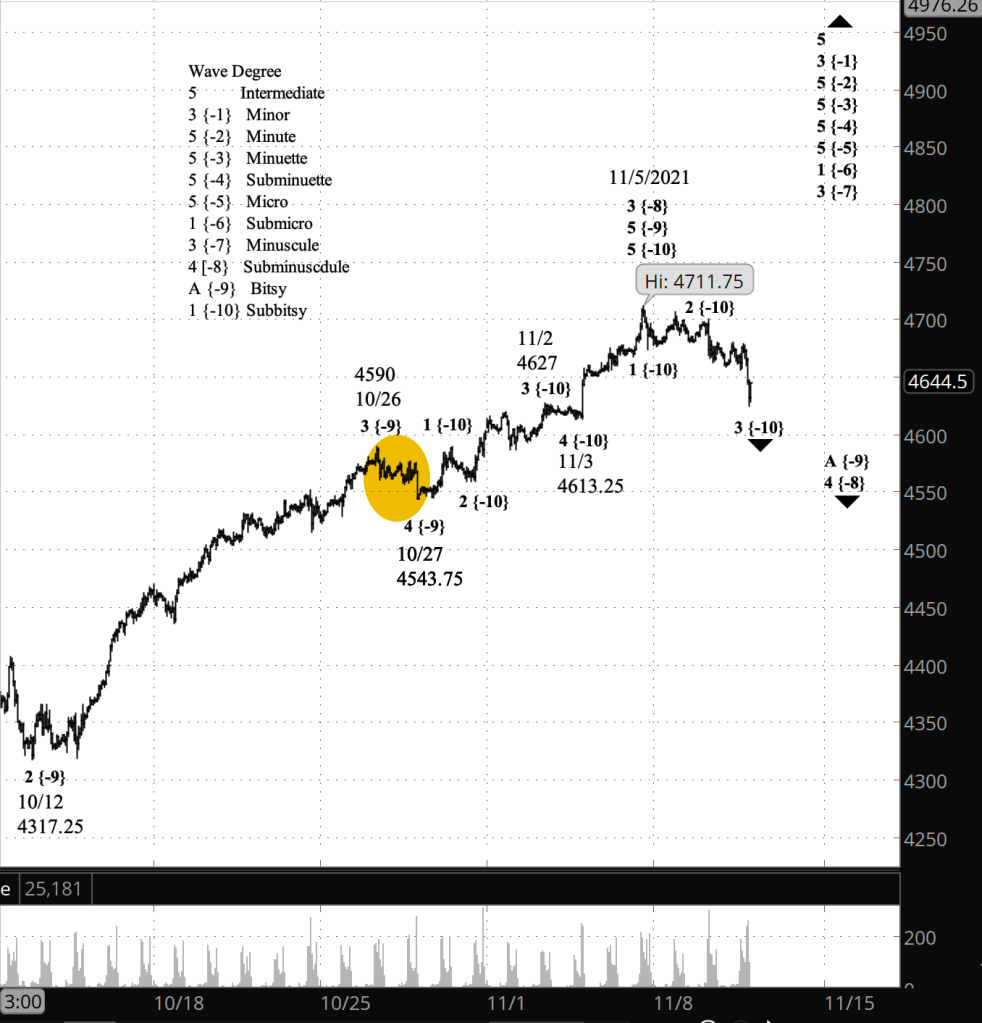
What does Elliott wave theory say? By my principal analysis, the correction is wave 4 of Subminuscule degree. The target is the 4th wave one degree lower within wave 3 of Subminuscule degree. Internally, Subminuscule 4 is in wave A of Bitsy degree, and within that, wave 3 of Subbitsy degree.
The completion of wave 4 of Subminuscule degree will mark the beginning of a 5th wave rise to new highs, which in turn when complete will mark the end of the parent wave 1 of Minsucule degree.
So, long story short: Shallow correction, new highs. Sideways for the short term, upward for the slightly longer term.
By my alternative analysis, wave 3 of Subminuscule degree is still underway, and the pullback is a lower degree correction that will soon reach its end as the 3rd-wave uptrend removes.
Long story short: The same as with the principle analysis (above), except a shallower correction and a longer wait for the end of Minuscule wave 1.
Learning and other resources. Elliott wave analysis provides context, not prophecy. As the 20th century semanticist Alfred Korzybski put it in his book Science and Sanity (1933), “The map is not the territory … The only usefulness of a map depends on similarity of structure between the empirical world and the map.” And I would add, in the ever-changing markets, we can judge that similarity of structure only after the fact.
See the menu page Analytical Methods for a rundown on where to go for information on Elliott wave analysis.
By Tim Bovee, Portland, Oregon, November 10, 2021
Disclaimer
Tim Bovee, Private Trader tracks the analysis and trades of a private trader for his own accounts. Nothing in this blog constitutes a recommendation to buy or sell stocks, options or any other financial instrument. The only purpose of this blog is to provide education and entertainment.
No trader is ever 100 percent successful in his or her trades. Trading in the stock and option markets is risky and uncertain. Each trader must make trading decisions for his or her own account, and take responsibility for the consequences.
License
All content on Tim Bovee, Private Trader by Timothy K. Bovee is licensed under a Creative Commons Attribution-ShareAlike 4.0 International License.
Based on a work at www.timbovee.com.

You must be logged in to post a comment.