3:30 p.m. New York time
Half an hour before the closing bell. The S&P 500 fell back slightly from its peak of the day. No change in the analysis. Wave A of Bitsy degree within wave 4 of Subminuscule degree continues. I’ve updated the chart.
2:15 p.m. New York time
My trades. I’ve closed by short bear call options spread on FXI for a loss and updated the entry analysis with results.
9:35 a.m. New York time
What’s happening now? The S&P 500 E-mini futures rose slightly in overnight trading, reaching 4661.50, and then fell slightly at the opening bell.
What does it mean? The rise is the second upward correction within the first downward leg of a larger correction that began on November 5.
What’s the alternative? The rise could be a level or two smaller than in my principal analysis, which means that the first leg of the larger correction has earlier potential to the downside.
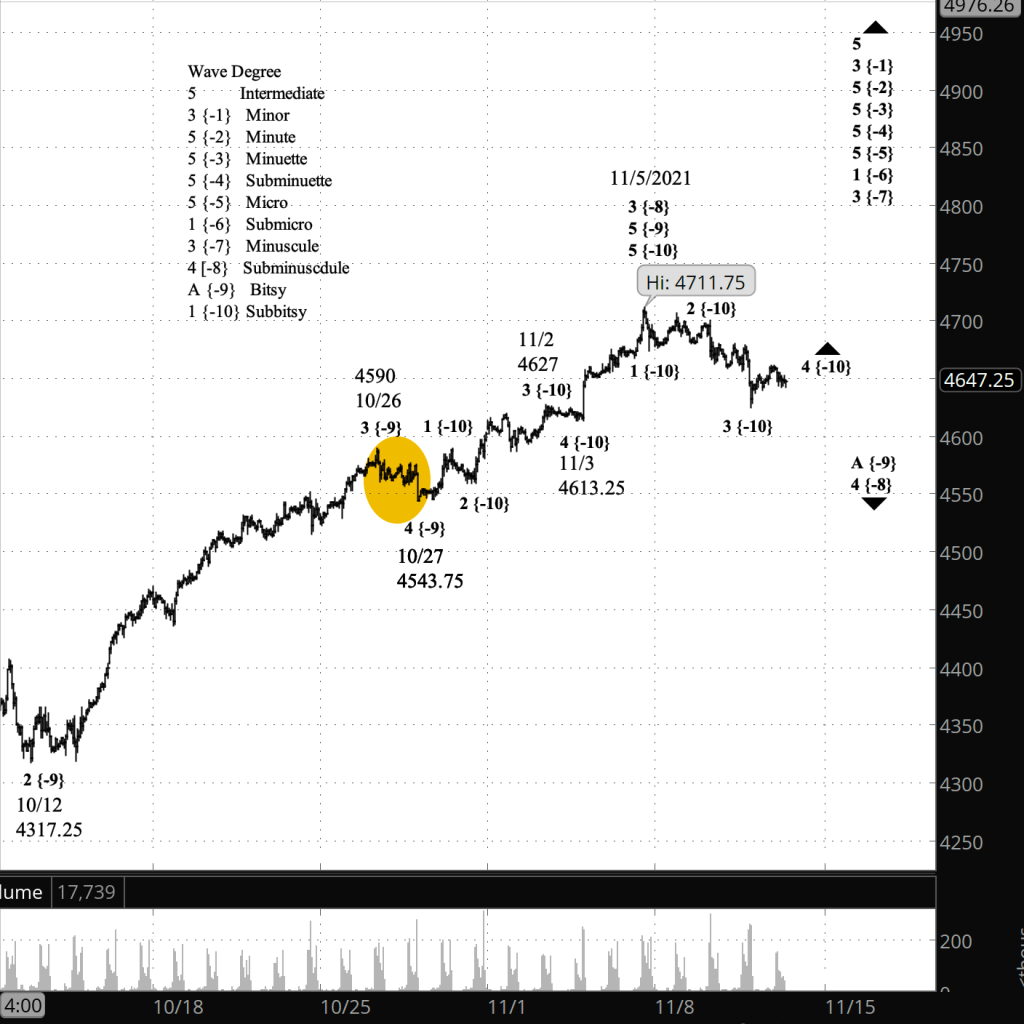
What does Elliott wave theory say? Under my principal analysis, the rise is wave 4 of Subbitsy degree within wave A of Bitsy degree, the latter being the first wave within a 4th wave correction of Subminuscule degree. The 4th wave of Subbitsy degree will be followed by a 5th wave decline that will likely bring the price within the correction’s target range, defined by the 4th wave of Bitsy degree within the 3rd wave of Subminuscule degree. I’ve marked that 4th wave on the chart with a tan oval.
Under my alternative analysis, the rise is part of a degree one or two levels below Subbitsy within declining wave 3 of Subbitsy degree. This scenario increases the likelihood that Subbitsy wave 3 will reach the target range before the subsequent wave 4 carries the price higher again.
The practical differences between the two scenarios is quite small. Under the principal analysis, the decline into the target range will come later than is likely under the alternative scenario.
Learning and other resources. Elliott wave analysis provides context, not prophecy. As the 20th century semanticist Alfred Korzybski put it in his book Science and Sanity (1933), “The map is not the territory … The only usefulness of a map depends on similarity of structure between the empirical world and the map.” And I would add, in the ever-changing markets, we can judge that similarity of structure only after the fact.
See the menu page Analytical Methods for a rundown on where to go for information on Elliott wave analysis.
By Tim Bovee, Portland, Oregon, November 11, 2021
Disclaimer
Tim Bovee, Private Trader tracks the analysis and trades of a private trader for his own accounts. Nothing in this blog constitutes a recommendation to buy or sell stocks, options or any other financial instrument. The only purpose of this blog is to provide education and entertainment.
No trader is ever 100 percent successful in his or her trades. Trading in the stock and option markets is risky and uncertain. Each trader must make trading decisions for his or her own account, and take responsibility for the consequences.
License
All content on Tim Bovee, Private Trader by Timothy K. Bovee is licensed under a Creative Commons Attribution-ShareAlike 4.0 International License.
Based on a work at www.timbovee.com.

You must be logged in to post a comment.