3:30 p.m. New York time
Half an hour before the closing bell. The S&P 500 rose slightly during the day, remaining well below the November 5 peak. No change in the analysis. The upward correction, wave 4 of Subbitsy degree within wave A of Bitsy degree within Wave 4 of Subminuscule degree, continues. I’ve updated the upper chart.
9:35 a.m. New York time
What’s happening now? The S&P 500 E-mini futures traded within a narrow range overnight.
What does it mean? The price continues to trace out a low-level upward correction within a higher level downward correction that began on November 5.
What’s the alternative? The main ambiguity has been how low of a level describes the present smaller correction. At this point it looks like the chart is labelled correctly. More on the subject in the Elliott wave theory section, below.
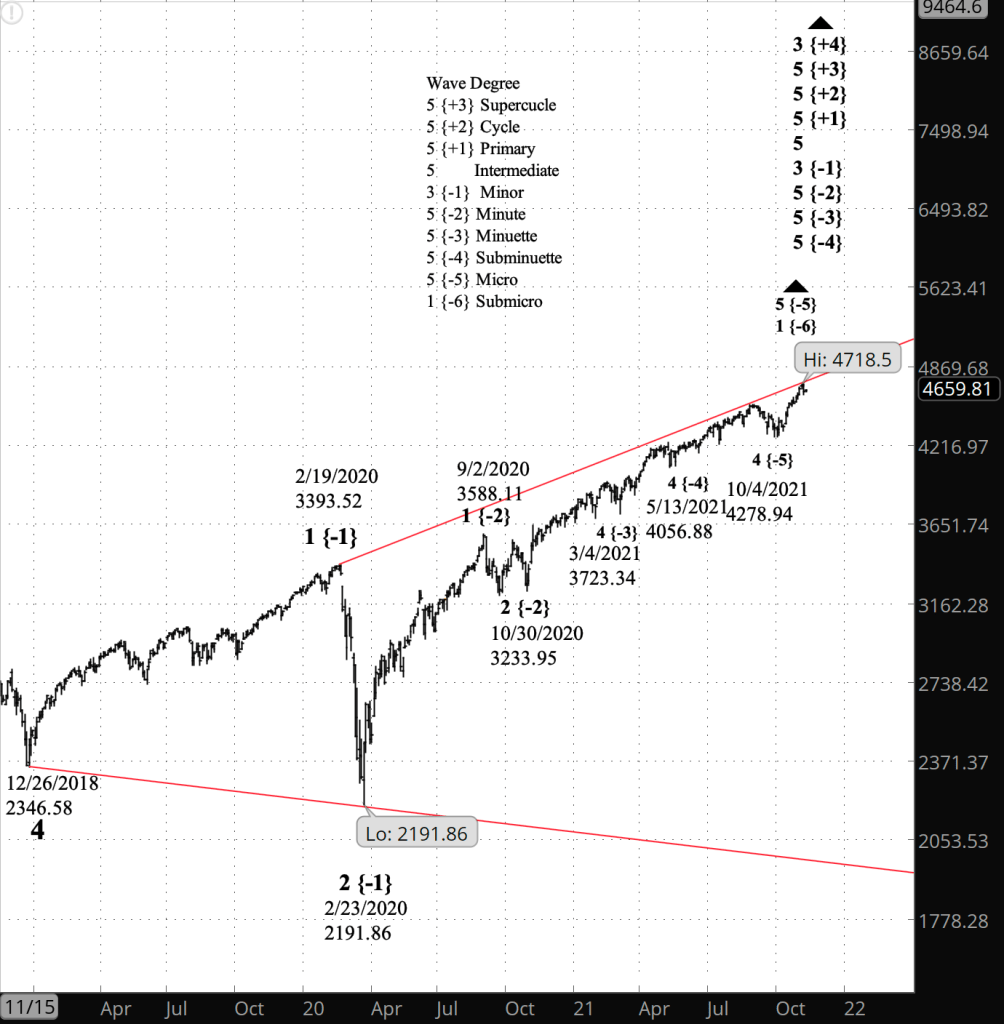
Charts. The lower chart shows a closer view of the S&P 500 E-mini futures stretching back to mid-October. The upper chart shows a broader view, of the S&P 500 index back to December 2018.
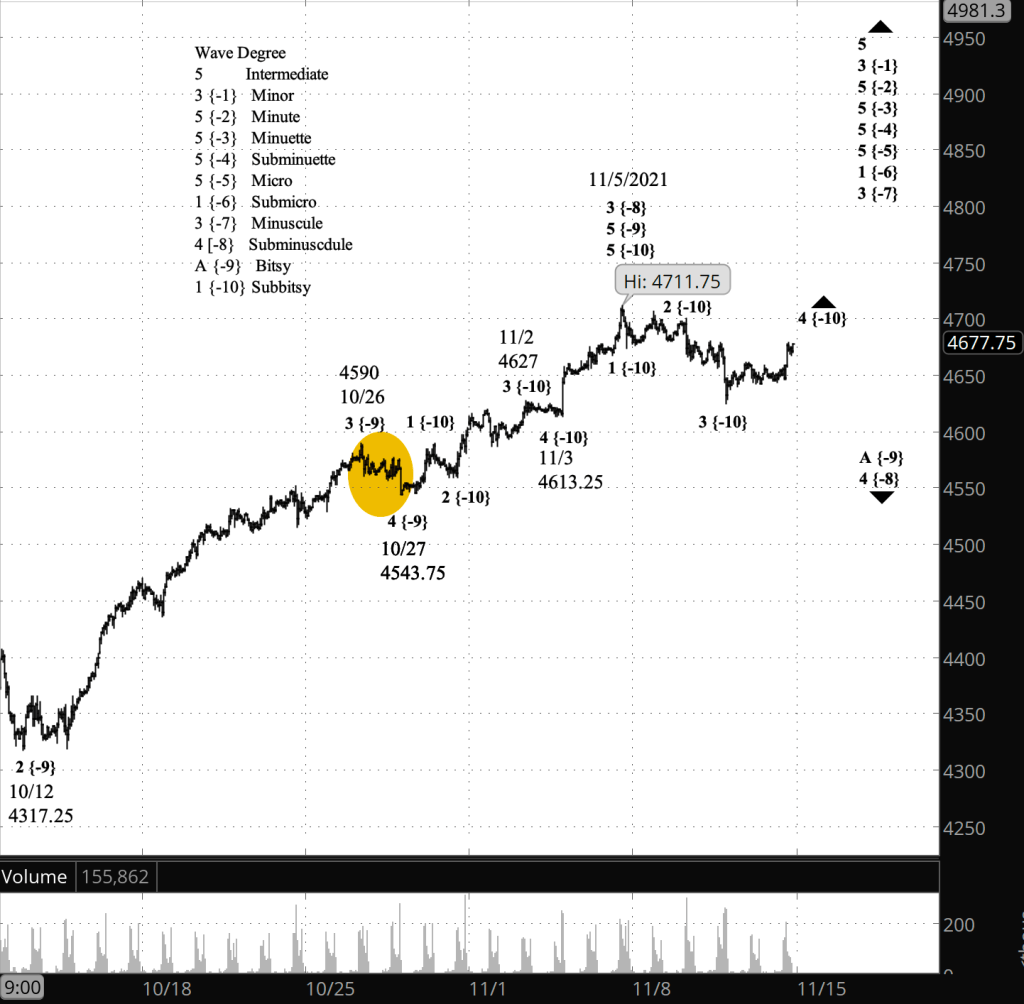
What does Elliott wave theory say? The low-level upward correction is wave 4 of Subbitsy degree — subscript {-10} — within wave A of Bitsy degree (-9} within the larger wave 4 of Subminuscule degree {-8}, a downward correction that began from the November 5 peak. (I use the subscripts for degree-labelling on the charts.)
As always in the early stages of a market movement, I’ve seen some ambiguity about the degree labelling. One degree down from Bitsy degree is Subbitsy, but it’s impossible to know wether or not the waves I labelled as Subbitsy actually are at the subscript {-10} level, or perhaps at {-11} or {-12}. It matters, because the smaller degree labelling impacts how I label the larger degrees.
At this point I’m comfortable with using the Subbitsy degree as the label for the smallest degree I’m tracking on this chart.
Fourth waves tend to be shallow, and the S&P 500’s present positioning is a 4th wave correction (Subbitsy) within a 4th wave correction (Subminuscule). All of that is happening within a rising 3rd wave of Minuscule degree {-7} within a 1st wave of Submicro degree {-8}, and going higher, within a series of 5th waves all the way up to wave 5 of Minute degree {-2}, which is within wave 3 of Minor degree {-1} within wave 5 of Intermediate degree (no subscript). The entire rise from the low of the early pandemic crash on February 23, 2020 is wave 3 of Minor degree.
Wave 5 of Intermediate degree is an expanding Diagonal Triangle that began on December 26, 2018.
Learning and other resources. Elliott wave analysis provides context, not prophecy. As the 20th century semanticist Alfred Korzybski put it in his book Science and Sanity (1933), “The map is not the territory … The only usefulness of a map depends on similarity of structure between the empirical world and the map.” And I would add, in the ever-changing markets, we can judge that similarity of structure only after the fact.
See the menu page Analytical Methods for a rundown on where to go for information on Elliott wave analysis.
By Tim Bovee, Portland, Oregon, November 12, 2021
Disclaimer
Tim Bovee, Private Trader tracks the analysis and trades of a private trader for his own accounts. Nothing in this blog constitutes a recommendation to buy or sell stocks, options or any other financial instrument. The only purpose of this blog is to provide education and entertainment.
No trader is ever 100 percent successful in his or her trades. Trading in the stock and option markets is risky and uncertain. Each trader must make trading decisions for his or her own account, and take responsibility for the consequences.
License
All content on Tim Bovee, Private Trader by Timothy K. Bovee is licensed under a Creative Commons Attribution-ShareAlike 4.0 International License.
Based on a work at www.timbovee.com.

You must be logged in to post a comment.