3:30 p.m. New York time
Half an hour before the closing bell. The S&P 500 began to decline during the morning in what may be the final leg within the first segment of a downward correction that began on November 5. In Elliott wave terms, my principal analysis sees the day’s decline as wave 5 of Subbitsy degree — subscript {-10} — within wave A of Bitsy degree {-9} within wave 4 of Subminuscule degree {-8}. The alternative analysis sees wave 4 of Subbitsy degree as still underway. I consider the alternative to be of lower probability because wave 4 of Subminuscule degree and its internal waves must remain below the November 5 peak of 4711.75, and there’s just not that much upside remaining above today’s peak of 4697.50. I’ve updated the chart.
9:35 a.m. New York time
What’s happening now? The S&P 500 E-mini futures rose into the 4690s in overnight trading as the downward correction following the November 5 peak, 4711.75, continues. Within that correction, a smaller, upward correction has been underway since November 10, and the chart can be interpreted to mean that the smaller correction is in its last leg.
What does it mean? The end of the smaller correction will be followed by a decline into the low 4600s and perhaps lower. The end of the decline will also mark the end of the first leg of the larger correction that is underway.
What’s the alternative? The overnight high has come within 15 points of the November 5 peak. If the price exceeds the peak — 4711.75 — then that will trigger a reworking of my principal analysis.
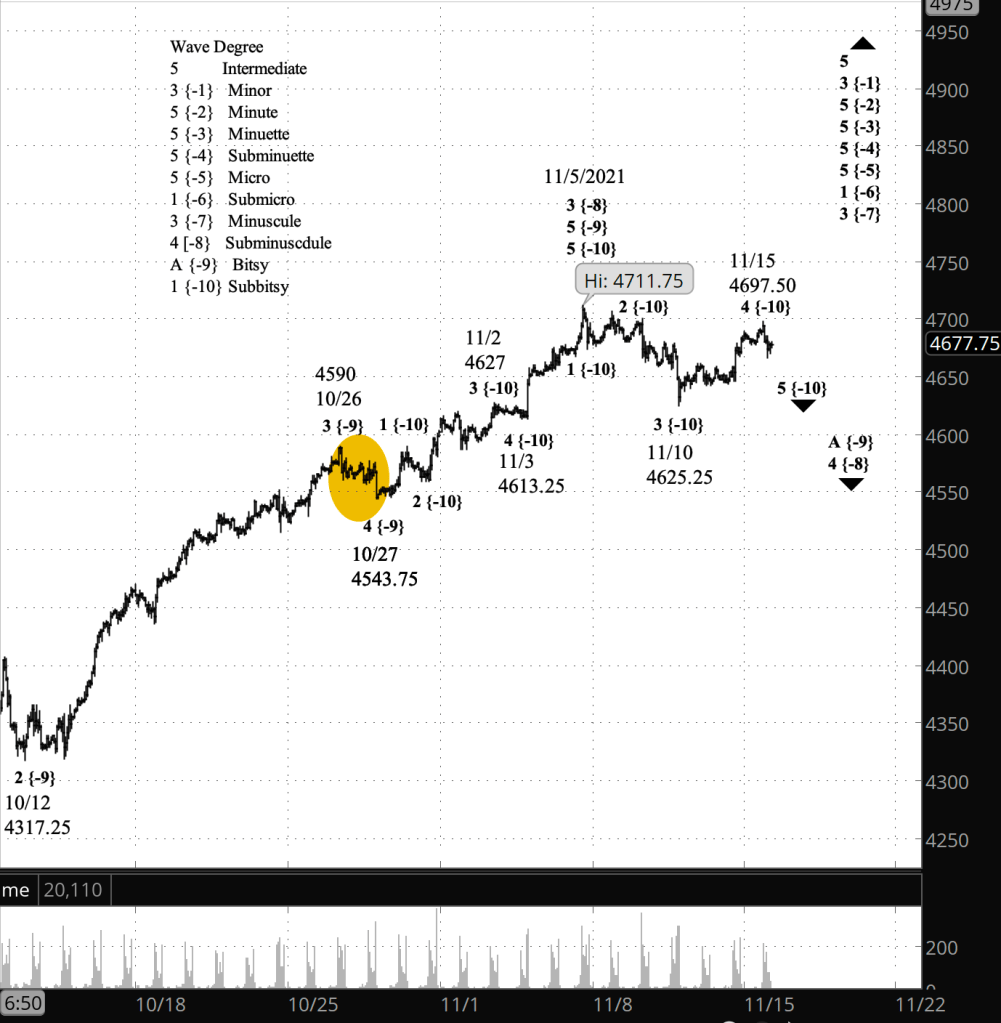
What does Elliott wave theory say? The price is in rising wave 4 of Subbitsy degree — subscript {-10} — within wave A of Bitsy degree {-9} within declining wave 4 of Subminuscule degree {-8}. When Subminuscule 4 is complete, the subsequent wave Subminuscule 5 will carry the price above the November 5 peak.
Although Subbitsy wave 4 appears to be in its 3rd and final wave, it is possible that it will form a compound correction, adding on a second corrective pattern.
The Subminuscule wave 4, if it behaves typically, will end in the 4th wave of the 3rd wave one degree lower. I’ve marked that range with a tan circle on the chart.
Learning and other resources. Elliott wave analysis provides context, not prophecy. As the 20th century semanticist Alfred Korzybski put it in his book Science and Sanity (1933), “The map is not the territory … The only usefulness of a map depends on similarity of structure between the empirical world and the map.” And I would add, in the ever-changing markets, we can judge that similarity of structure only after the fact.
See the menu page Analytical Methods for a rundown on where to go for information on Elliott wave analysis.
By Tim Bovee, Portland, Oregon, November 15, 2021
Disclaimer
Tim Bovee, Private Trader tracks the analysis and trades of a private trader for his own accounts. Nothing in this blog constitutes a recommendation to buy or sell stocks, options or any other financial instrument. The only purpose of this blog is to provide education and entertainment.
No trader is ever 100 percent successful in his or her trades. Trading in the stock and option markets is risky and uncertain. Each trader must make trading decisions for his or her own account, and take responsibility for the consequences.
License
All content on Tim Bovee, Private Trader by Timothy K. Bovee is licensed under a Creative Commons Attribution-ShareAlike 4.0 International License.
Based on a work at www.timbovee.com.

You must be logged in to post a comment.