3:30 p.m. New York time
Half an hour before the closing bell. The S&P 500 continued its slow decline during the day, remaining below yesterday’s high, 4709.75. No change in the analysis. I’ve updated the chart.
9:35 a.m. New York time
What’s happening now? The S&P 500 E-mini futures rose to 4709.75 within two points of the November 5 peak and then declined slightly
What does it mean? The pattern leaves uncertainty over whether the upward correction that began on November 10 is still underway, or whether the next movement, to the downside, has begun. I’ve marked the chart to reflect the first scenario: The upward correction is ongoing,
What’s the alternative? If the price continues to rise and moves above 4711.75, the November 5 peak, then that peak is likely just a stopping point on the the rise that began October 6 and that is still underway.
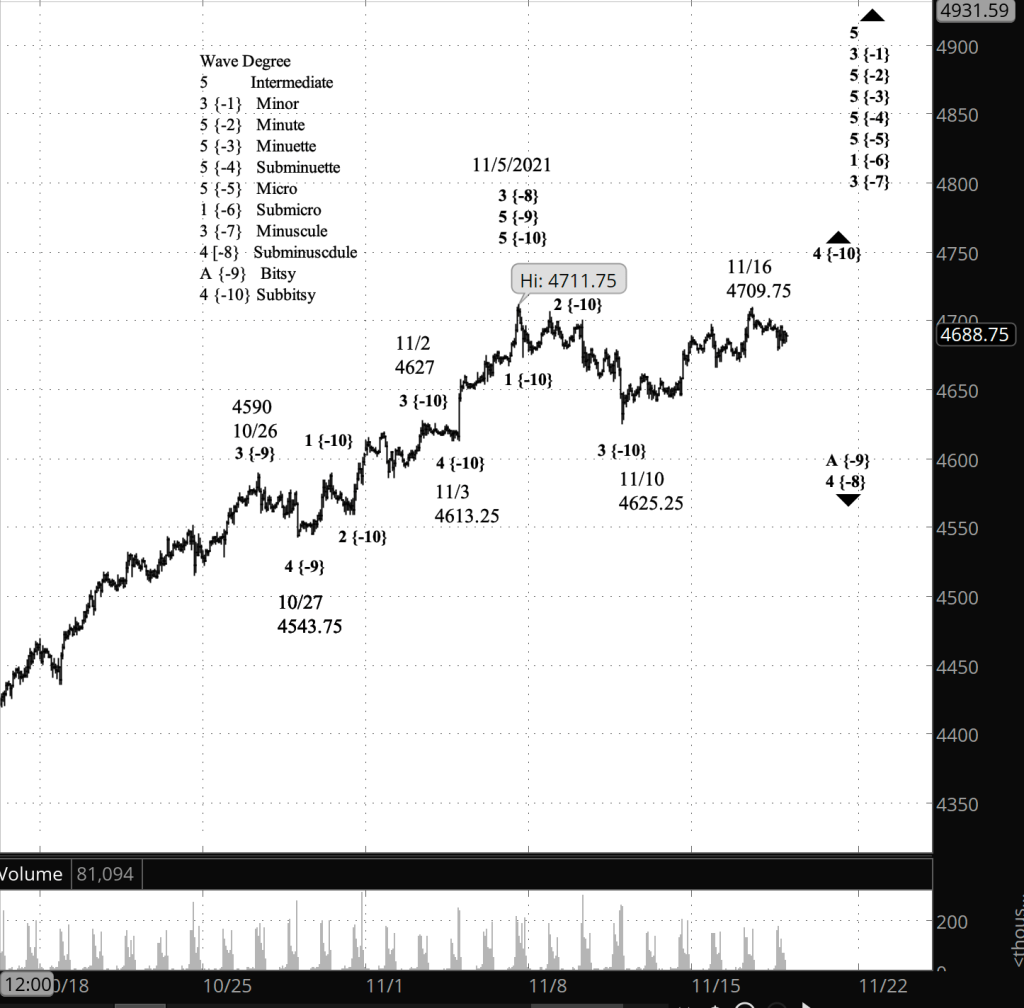
What does Elliott wave theory say? By my principal analysis, wave 4 of Subbitsy degree — subscript {-10} — is underway, an upward movement within wave A of Bitsy degree {-9}, which is the first portion of a three-wave corrective pattern, wave 4 of Subminuscule degree {-8}. Subminuscule 4 began on November 5 from 4711.75.
Last night’s high is the highest high point since Subbitsy wave 4 began. It could be that it marks the end of that upward correction, or there could be a bit more upside remaining. If Subbitsy wave 4 is a Flat pattern or a Zigzag, then it cannot move above the November 5 high, 4711.75. If it does move above that level, then it is either a Triangle of some sort, forming Subminuscule wave 4, or the November 5 peak didn’t mark the end of Subminuscule wave 3, which under this scenario is still underway.
It’s also possible that what I’ve treated as Subbitsy degree is really Bitsy degree, waves A and B, leaving only wave C to the downside to reach completion, marking the end of wave 4 of Subminuscule degree and the start of a rise to new heights as wave 5 of Subminuscule degree.
Time will provide us with evidence to sort these questions out.
Learning and other resources. Elliott wave analysis provides context, not prophecy. As the 20th century semanticist Alfred Korzybski put it in his book Science and Sanity (1933), “The map is not the territory … The only usefulness of a map depends on similarity of structure between the empirical world and the map.” And I would add, in the ever-changing markets, we can judge that similarity of structure only after the fact.
See the menu page Analytical Methods for a rundown on where to go for information on Elliott wave analysis.
By Tim Bovee, Portland, Oregon, November 17, 2021
Disclaimer
Tim Bovee, Private Trader tracks the analysis and trades of a private trader for his own accounts. Nothing in this blog constitutes a recommendation to buy or sell stocks, options or any other financial instrument. The only purpose of this blog is to provide education and entertainment.
No trader is ever 100 percent successful in his or her trades. Trading in the stock and option markets is risky and uncertain. Each trader must make trading decisions for his or her own account, and take responsibility for the consequences.
License
All content on Tim Bovee, Private Trader by Timothy K. Bovee is licensed under a Creative Commons Attribution-ShareAlike 4.0 International License.
Based on a work at www.timbovee.com.

You must be logged in to post a comment.