3:30 p.m. New York time
Half an hour before the closing bell. The S&P 500 peaked at 4740.50 on the futures, 4743.83 on the index, after President Biden’s announcement on the retention of Jerome Powell as Fed chair. The price then declined sharply and rose again, sharply.
I attributed the market movement to the Powell announcement. Elliott wave theory would have it that the nature of the market’s reaction is a reflection of the public mood, the Zeitgeist of the moment. Had the public mood been negative, the theory goes, then the price might well have declined after the same announcement.
No change in the analysis. I’ve updated the chart.
10:20 a.m. New York time
New peak. The S&P 500 shot up to a new peak after President Biden said he would retain Jerome Powell as Fed chair. Up to 4740.50 so far on the futures, 4743.83 on the index. The move adds credence to my principal analysis earlier this morning. Chart updated.
9:35 a.m. New York time
What’s happening now? The S&P 500 E-mini futures rose in overnight trading, remaining below the November 19 peak, 4723.50.
What does it mean? The rise that began on November 10 from 4625.25 is continuing.
What’s the alternative? The November 14 peak was the end of the rise that began on November 10, and a low-level sideways correction has begun.
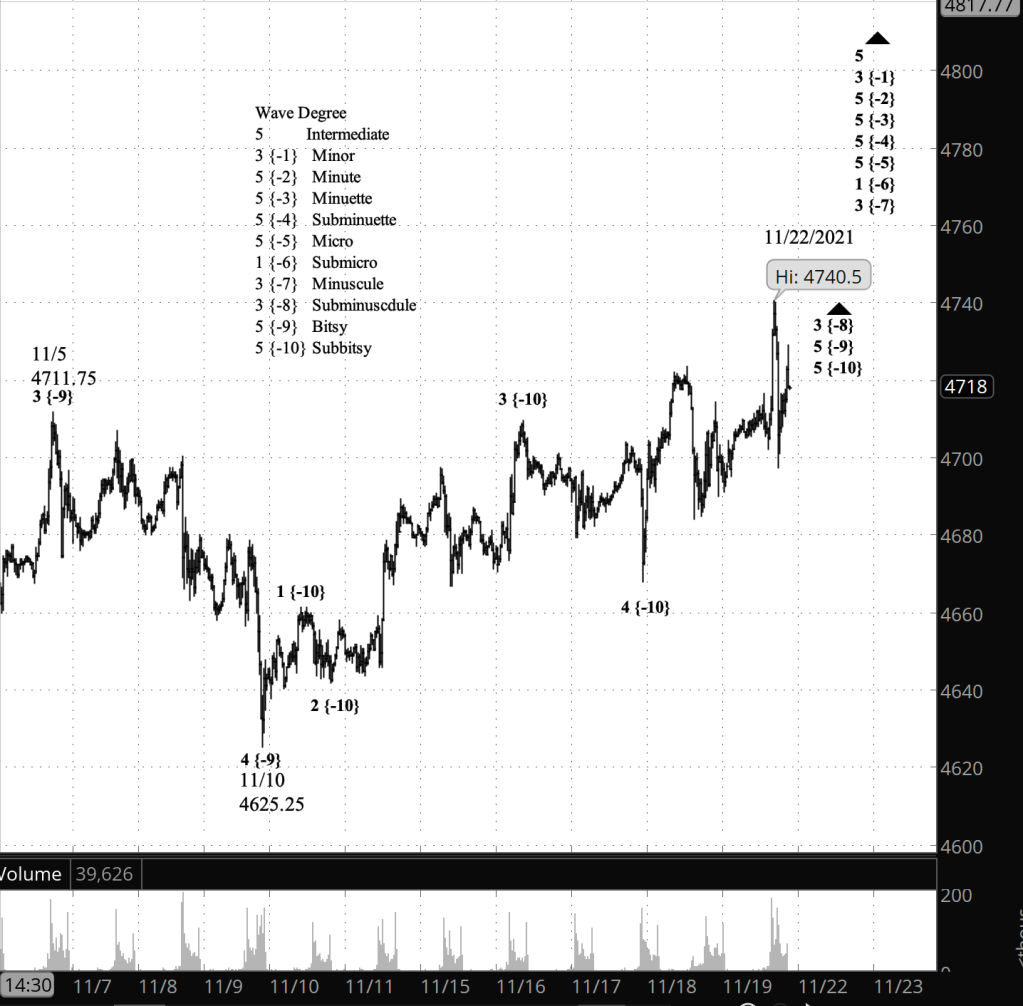
What does Elliott wave theory say? By my principal count, wave 5 of Subbitsy degree — subscript {-10} — within wave 5 of Bitsy degree {-9} within wave 3 of Subminuscule degree {-8} is underway. The completion of Subbitsy 5 and its parent, Bitsy 5, will also be the end of Subminuscule 3 and the beginning of the 4th wave of Subminuscule degree, which most likely will take the from of a Flat, although that’s not a certainty.
Although the futures peaked on November 19 — last Friday — the S&P 500 index did not, creating a discrepancy between two symbols that in theory should follow each other very closely. One thing to look for today was whether the index exceeds Friday’s high, 4718.50, and indeed, it did, reaching 4725.78 at the opening bell.
Learning and other resources. Elliott wave analysis provides context, not prophecy. As the 20th century semanticist Alfred Korzybski put it in his book Science and Sanity (1933), “The map is not the territory … The only usefulness of a map depends on similarity of structure between the empirical world and the map.” And I would add, in the ever-changing markets, we can judge that similarity of structure only after the fact.
See the menu page Analytical Methods for a rundown on where to go for information on Elliott wave analysis.
By Tim Bovee, Portland, Oregon, November 22, 2021
Disclaimer
Tim Bovee, Private Trader tracks the analysis and trades of a private trader for his own accounts. Nothing in this blog constitutes a recommendation to buy or sell stocks, options or any other financial instrument. The only purpose of this blog is to provide education and entertainment.
No trader is ever 100 percent successful in his or her trades. Trading in the stock and option markets is risky and uncertain. Each trader must make trading decisions for his or her own account, and take responsibility for the consequences.
License
All content on Tim Bovee, Private Trader by Timothy K. Bovee is licensed under a Creative Commons Attribution-ShareAlike 4.0 International License.
Based on a work at www.timbovee.com.

You must be logged in to post a comment.