3:30 p.m. New York time
Half an hour before the closing bell. The S&P 500 fell slightly lower during the day, to 4649 on the futures, and then rose slightly, remaining below the high point of the morning, 4695.50. The day’s highs and lows on the index were 4690.39 and 4652.66. No change in the analysis. I’ve updated the chart.
9:35 a.m. New York time
What’s happening now? The S&P 500 fell in overnight trading, to 4654.50, and then rose slightly.
What does it mean? The November 22 peak, 4740.50, marked the end of a rise that began October 6 and the beginning of a downward correction.
What’s the alternative? The decline from the November 22 peak is a low-level correction within a continuing uptrend that began October 6.
At this point, honestly, I can’t choose between the two, but the sharpness of the decline suggests that my principal analysis is the more likely interpretation of the market’s movement.
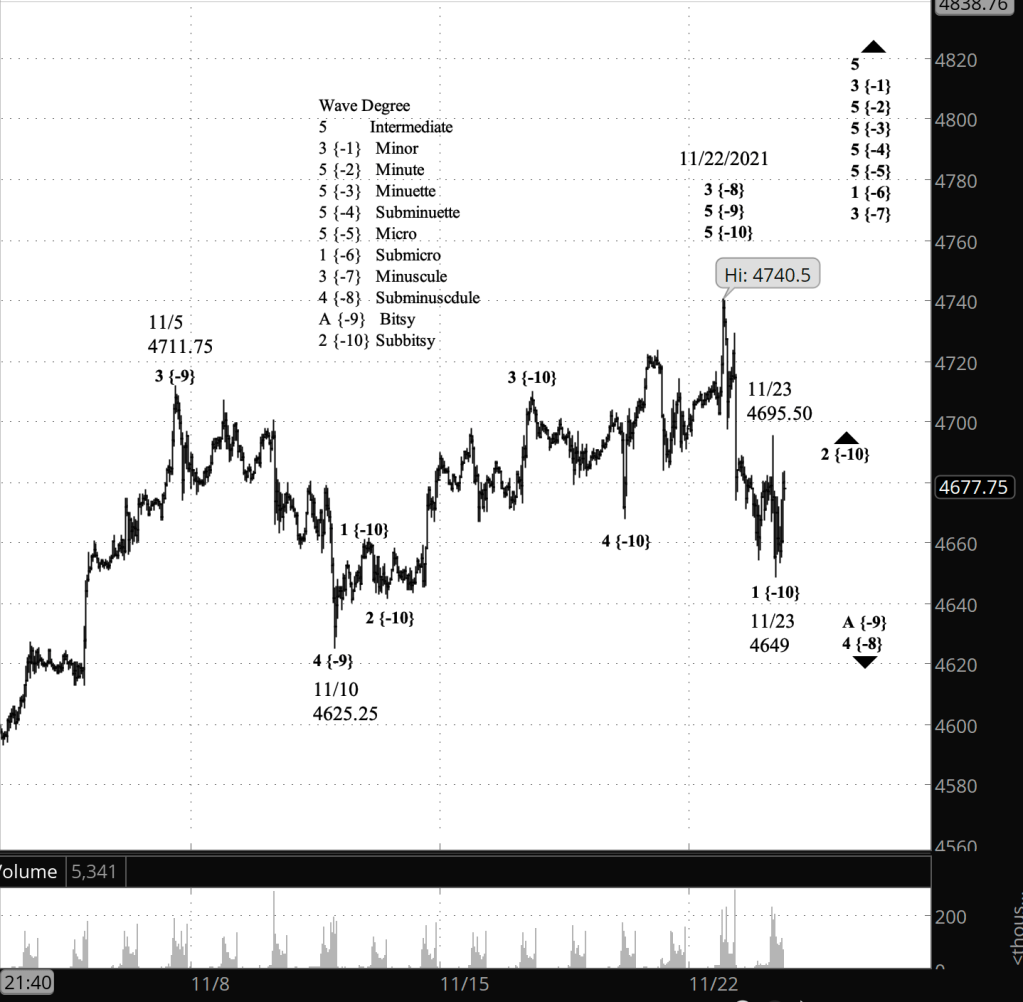
What does Elliott wave theory say? Under my principal analysis, wave 4 of Subminuscule degree — subscript {-8} — is now underway, having begun with the decline from the November 22 high. Internally, the 4th wave is in its initial decline — wave A of Bitsy degree {-9} — which in turn is in an upward correction, wave 2 of Subbitsy degree {-10}.
Under my alternative analysis, wave 3 of Subminuscule degree, which began October 6, is still underway. Within it, the price is tracing wave 5 of Bitsy degree, and one step further down, wave 5 of Subbitsy degree.
In either case, the 4th wave that follows wave 3 of Subminuscule degree will be followed by a 5th-wave rise to a new peak, and then by a 2nd-wave correction of Submicro degree {-6}
Learning and other resources. Elliott wave analysis provides context, not prophecy. As the 20th century semanticist Alfred Korzybski put it in his book Science and Sanity (1933), “The map is not the territory … The only usefulness of a map depends on similarity of structure between the empirical world and the map.” And I would add, in the ever-changing markets, we can judge that similarity of structure only after the fact.
See the menu page Analytical Methods for a rundown on where to go for information on Elliott wave analysis.
By Tim Bovee, Portland, Oregon, November 23, 2021
Disclaimer
Tim Bovee, Private Trader tracks the analysis and trades of a private trader for his own accounts. Nothing in this blog constitutes a recommendation to buy or sell stocks, options or any other financial instrument. The only purpose of this blog is to provide education and entertainment.
No trader is ever 100 percent successful in his or her trades. Trading in the stock and option markets is risky and uncertain. Each trader must make trading decisions for his or her own account, and take responsibility for the consequences.
License
All content on Tim Bovee, Private Trader by Timothy K. Bovee is licensed under a Creative Commons Attribution-ShareAlike 4.0 International License.
Based on a work at www.timbovee.com.

You must be logged in to post a comment.