3:30 p.m. New York time
Half an hour before the closing bell. The S&P 500 has risen during the day to 4669.75 so far on the futures, 4672.95 on the index, a price level slightly above a 61.8% retracement of the preceding decline that began on November 25. In Elliott wave terms, wave 4 of Subbitsy degree {-10} continued to rise. Internally, it is in its C wave (the 3rd and final wave in both a Flat and a Zigzag pattern). No change in the analysis. I’ve updated the chart.
9:35 a.m. New York time
What’s happening now? The S&P 500 E-mini futures continued Friday’s rise when trading resumed on Sunday, so far retracing 50% of the of preceding decline.
What does it mean? The movement clarifies that the decline that began November 25 ended on November 26 at 4577.25, and that an upward correction began from that point. Most likely, the correction will be shallow. All of this is happening within the larger downtrend that began on November 22 from 4717, which is the endpoint of a rise that began on October 6 from 4273.75.
What’s the alternative? The rise of October 6 may still be underway, and the decline from November 25 may be a downward correction within that ongoing rise. Another ambiguity, at a smaller level: Even if the decline is still underway, what I’m showing as the second upward correction within the early part of the decline may in fact be the first correction. See more in the Elliott wave theory discussion below.
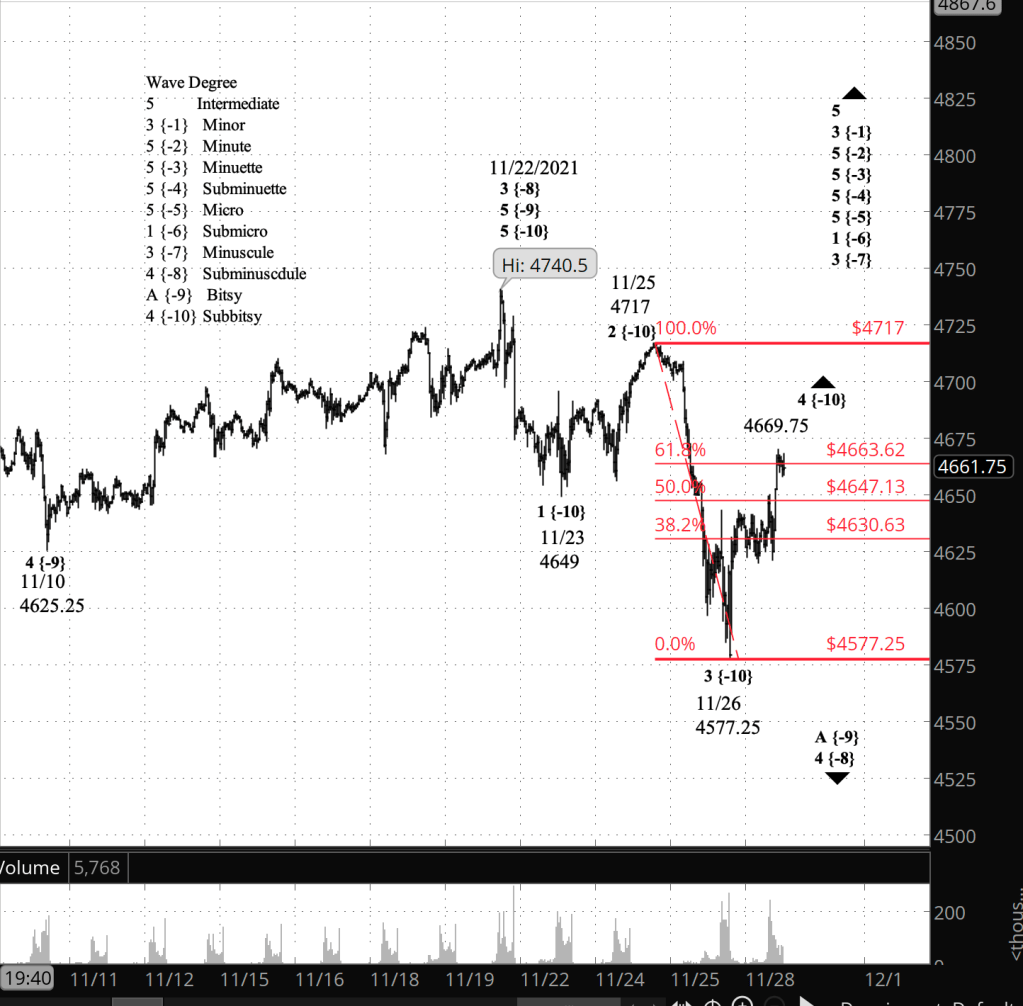
What does Elliott wave theory say? The present rise is wave 4 of Subbitsy degree — subscript {-10} — and I’ve added a Fibonacci ladder to measure the retracement by wave 4 of the preceding decline, wave 3 of Subbitsy degree. A 4th wave tends to be shallow — a Flat pattern — if the preceding 2nd wave was directional, such as a Zigzag pattern. I expect this Subbitsy 4th wave to be shallow, and for such a wave, a 50% retracement is a common upper boundary.
The problem with all of this is that internally, wave 3 of Subbitsy degree lacks a clear 2nd wave one degree lower. So it’s possible that what I’ve labeled as the end of wave 3 of Subbitsy degree is in fact the end of the 1st wave, and what I’ve called wave 4 of Subbitsy degree is in fact the beginning of Subbitsy wave 2. A shallow retracement, such as 50%, would indicate that the 4th wave label is correct. A rise that approaches the beginning of Subbitsy wave 1, from 4740.50, while remaining below that level would indicate that a more directional 2nd wave correction is underway.
At larger degrees, my principal analysis marks November 22 as the end of wave 3 of Subminuscule degree {-8}, and everything since has been a larger 4th wave. Working up from the lowest level I’m tracking, a downtrending wave 4 of Subbitsy degree is within downtrending wave A of Bitsy degree {-9} within downtrending wave 4 of Subminuscule degree.
All of that is happening within wave 3 of Minuscule degree {-7}, which began on October 1 and is trending upward.
Under my alternative analysis, at the higher levels, the November 22 high didn’t mark the end of wave 3 of Subminuscule degree, but instead kicked off a lower degree correction which will be followed by a continuation of Subminuscule wave 3’s ongoing rise.
Learning and other resources. Elliott wave analysis provides context, not prophecy. As the 20th century semanticist Alfred Korzybski put it in his book Science and Sanity (1933), “The map is not the territory … The only usefulness of a map depends on similarity of structure between the empirical world and the map.” And I would add, in the ever-changing markets, we can judge that similarity of structure only after the fact.
See the menu page Analytical Methods for a rundown on where to go for information on Elliott wave analysis.
By Tim Bovee, Portland, Oregon, November 29, 2021
Disclaimer
Tim Bovee, Private Trader tracks the analysis and trades of a private trader for his own accounts. Nothing in this blog constitutes a recommendation to buy or sell stocks, options or any other financial instrument. The only purpose of this blog is to provide education and entertainment.
No trader is ever 100 percent successful in his or her trades. Trading in the stock and option markets is risky and uncertain. Each trader must make trading decisions for his or her own account, and take responsibility for the consequences.
License
All content on Tim Bovee, Private Trader by Timothy K. Bovee is licensed under a Creative Commons Attribution-ShareAlike 4.0 International License.
Based on a work at www.timbovee.com.

You must be logged in to post a comment.