12:30 p.m. New York time
Half an hour before the closing bell. The S&P 500 reversed from its rise that began before the opening bell, falling to 4585 on the futures before reversing slightly. Under my principal analysis, I’m counting the fall from the November 25 high of 4717 as the start of wave 3 of Subbitsy degree — subscript {-10} — the rise this morning from 4597 to 4643.25 as Subbitsy 4, and the decline to 4585 as Subbitsy 5, which may still be underway. Or not. There’s no way to tell. The end of Subbitsy 5 will also be the of its parent wave A of Bitsy degree {-9}, which will be followed by a wave B rise that will take back a portion of the fall since yesterday. I’ve updated the upper chart.
9:35 a.m. New York time
Short session. The post-holiday trading session will end early today, at 1 p.m. New York time.
What’s happening now? The S&P 500 E-mini futures picked up momentum in their decline from yesterday’s peak of 4717, rapidly falling to 4597 in overnight trading.
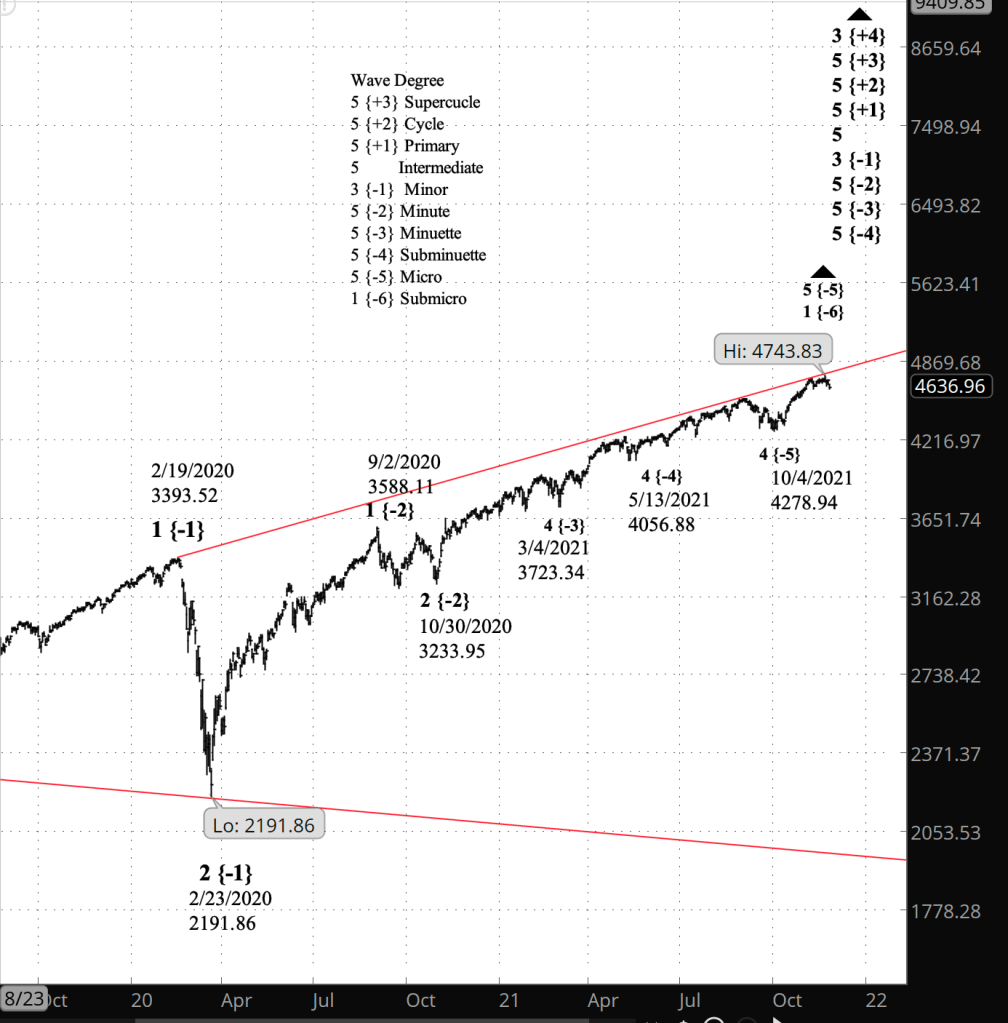
What does it mean? The low-level upward correction that began on November 23 is complete, and the middle portion of the downtrend from November 22 has begun. The November 22 peak marked the end of the uptrend that began on November 10 within a larger uptrend that began October 6 from 4273.75.
What’s the alternative? The price moved below the low of November 10, weakening my prior alternative analysis concluding that the uptrend from that date could still be underway. At this point, I have no alternative to replace it.
Charts. The upper chart is a close-up view tracking the futures back to November 8. The lower chart is the S&P 500 index tracking the price back to August 22, 2019.
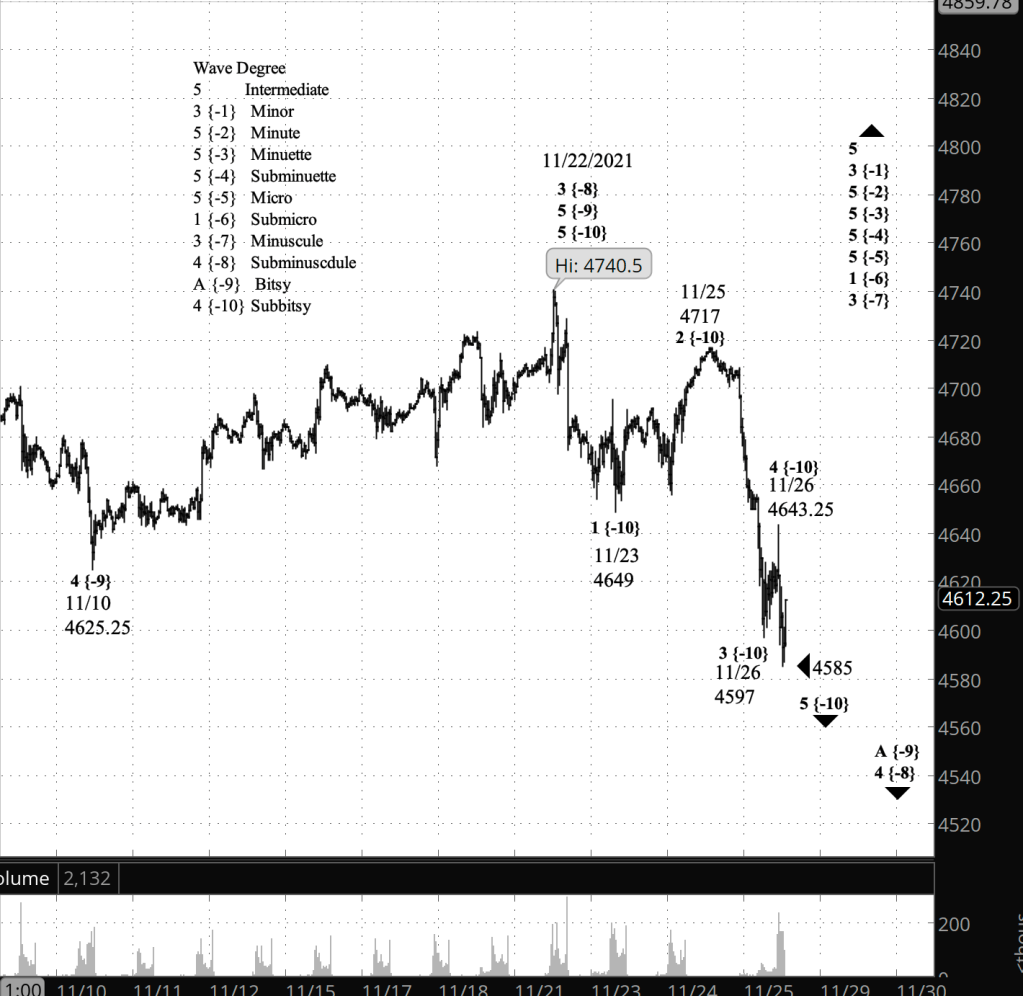
What does Elliott wave theory say? The decline from the November 25 high to today’s the overnight low is wave 3 of Subbitsy degree — subscript {-10} — and the subsequent bounce, still underway, is Subbitsy wave 4. This is all happening within wave A of Bitsy degree {-9} within wave 4 of Subminuscule degree {-8} within wave 3 of Minuscule degree {-7}.
Subbitsy 4’s rise will be followed by further decline, wave 5 of Subbitsy degree, which will mark the end of wave A of Bitsy degree. Bitsy wave A will be followed by an uptrending B wave and then a downtrendng C wave, completing wave 4 of Subminuscule degree.
Learning and other resources. Elliott wave analysis provides context, not prophecy. As the 20th century semanticist Alfred Korzybski put it in his book Science and Sanity (1933), “The map is not the territory … The only usefulness of a map depends on similarity of structure between the empirical world and the map.” And I would add, in the ever-changing markets, we can judge that similarity of structure only after the fact.
See the menu page Analytical Methods for a rundown on where to go for information on Elliott wave analysis.
By Tim Bovee, Portland, Oregon, November 26, 2021
Disclaimer
Tim Bovee, Private Trader tracks the analysis and trades of a private trader for his own accounts. Nothing in this blog constitutes a recommendation to buy or sell stocks, options or any other financial instrument. The only purpose of this blog is to provide education and entertainment.
No trader is ever 100 percent successful in his or her trades. Trading in the stock and option markets is risky and uncertain. Each trader must make trading decisions for his or her own account, and take responsibility for the consequences.
License
All content on Tim Bovee, Private Trader by Timothy K. Bovee is licensed under a Creative Commons Attribution-ShareAlike 4.0 International License.
Based on a work at www.timbovee.com.

You must be logged in to post a comment.