3 p.m. New York time
What’s happening now? Although U.S. markets were closed today for the Thanksgiving holiday, the S&P 500 E-mini futures traded in markets elsewhere. The futures rose in overnight trading to 4717 and then declined by 12 points, staying well bellow the November 22 peak of 4740.50 and above the November 23 low of 4649.
What does it mean? The rise can be counted as completing the second leg within the first portion of an upward correction that began on November 23, within a downtrend that began on November 22. I’ve used this labelling on the chart.
What’s the alternative? The rise from November 23 can be seen as the first leg of the correction, to be followed by a downward move and then another move up. A second alternative would have the decline from November 22 as a correction within a still ongoing uptrend.
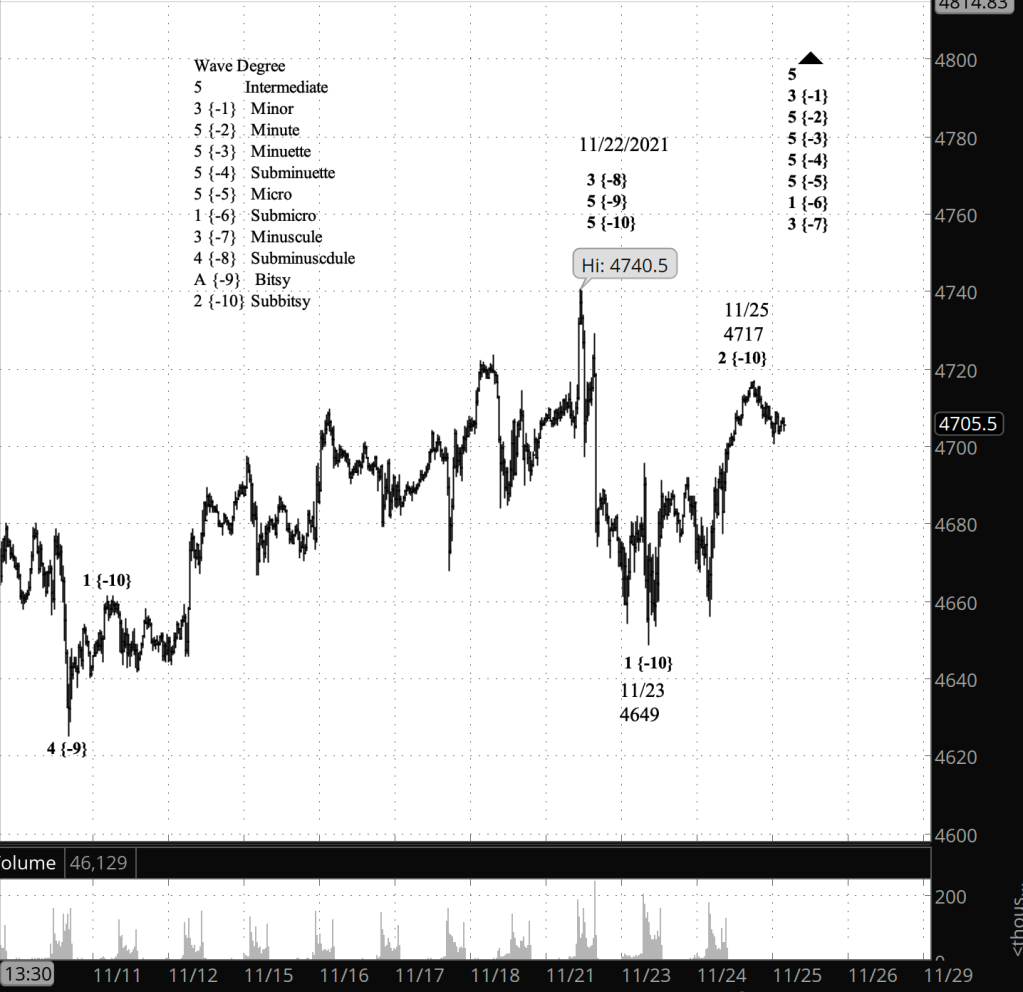
What does Elliott wave theory say? Under the principal analysis, the November 22 peak marked the end of wave 3 of Subminuscule degree — subscript {-8} — and the subsequent decline is Subminuscule wave 4, which is still underway. Within the 4th wave, I count wave 1 of Subbitsy degree {-10} as having ended on November 23, and Subbitsy wave 2 as having ended today in overnight trading, all within wave A of Bitsy degree {-9}.
Under the first secondary analysis, wave 2 of Subbitsy degree is still underway.
Under the second secondary analysis, the November 22 peak doesn’t mark the end of wave 3 of Subminuscule degree. The the decline from that date is a low level correction within that wave as it continues its rise.
Learning and other resources. Elliott wave analysis provides context, not prophecy. As the 20th century semanticist Alfred Korzybski put it in his book Science and Sanity (1933), “The map is not the territory … The only usefulness of a map depends on similarity of structure between the empirical world and the map.” And I would add, in the ever-changing markets, we can judge that similarity of structure only after the fact.
See the menu page Analytical Methods for a rundown on where to go for information on Elliott wave analysis.
By Tim Bovee, Portland, Oregon, November 25, 2021
Disclaimer
Tim Bovee, Private Trader tracks the analysis and trades of a private trader for his own accounts. Nothing in this blog constitutes a recommendation to buy or sell stocks, options or any other financial instrument. The only purpose of this blog is to provide education and entertainment.
No trader is ever 100 percent successful in his or her trades. Trading in the stock and option markets is risky and uncertain. Each trader must make trading decisions for his or her own account, and take responsibility for the consequences.
License
All content on Tim Bovee, Private Trader by Timothy K. Bovee is licensed under a Creative Commons Attribution-ShareAlike 4.0 International License.
Based on a work at www.timbovee.com.

You must be logged in to post a comment.