3:30 p.m. New York time
Half an hour before the closing bell. The S&P 500 has fallen during the day, reaching a low so far of 4662.50 on the futures, 4671.84 on the index. Although the index from this morning is unchanged, the 57-point decline strengthens the possibility that the Sunday’s high of 47198.25 on the futures marked the end of the 5th wave within wave C of Subdeci degree — subscript {-12} within wave 4 of Deci degree {-11} within downtrending wave 3 of Subbitsy degree {-10}, which began on November 29. If the decline continues tomorrow, I’ll rework the wave numbering to reflect the end of Deci 4 and the start of the subsequent 5th wave, which will carry the price down to the 4490s and perhaps lower. I’ve updated the chart.
9:35 a.m. New York time
What’s happening now? On Sunday night, the S&P 500 E-mini futures reached a new high, 4719.25, in the rise that has been underway since December 3.
What does it mean? The third wave of an upward correction that began on December 1 is still underway, although reaching its end. The correction is part of a larger downtrend.
What’s the alternative? If the price should exceed the all-time high of 4740.50 set on November 22, then the rise that began on October 6 may not have reached an end, and the decline of the past weeks can be seen as a downward correction within that rise.
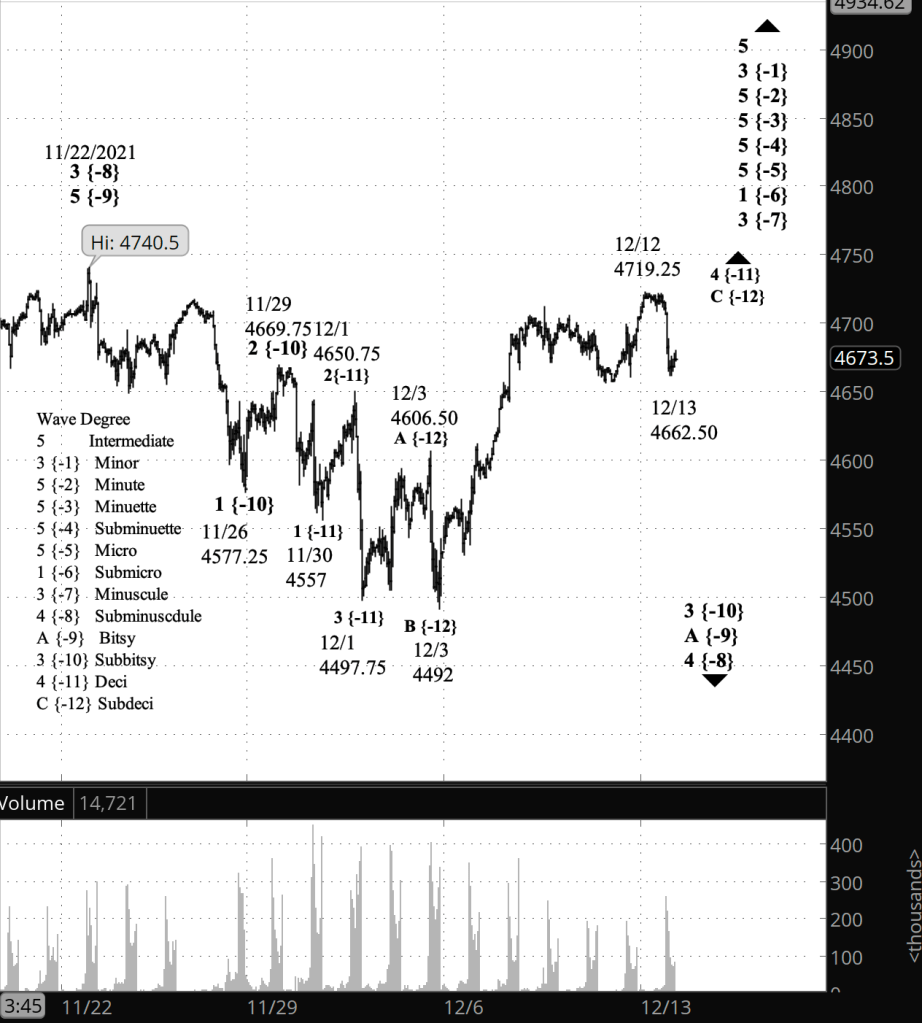
What does Elliott wave theory say? My principal analysis remains unchanged from Friday. The price is moving through wave C of Subdeci degree within wave 4 of Deci degree within wave 3 of Subbitsy degree within wave A of Bitsy degree within wave 4 of Subminuscule degree. The subscripts are {-12} beginning with Subdeci up to {-8} for Subminuscule.
Internally, there’s an argument to be made that Sunday’s high within the correction could mark the end of the correction, as it is possible to count a five-wave rise, which is expected for this C wave. If this is the case, then the decline from the high is the start of wave 5 of Deci degree, which will reach down to the 4590s or lower.
The price is getting close to the November 22 high, 4740.50, that ended with 3 of Subminuscule degree. Under the norms identified within Elliott wave analysis, the price of this correction ought to remain below that level. If it exceeds it, then I’ll need to revisit the chart and revise my count of the waves.
Learning and other resources. Elliott wave analysis provides context, not prophecy. As the 20th century semanticist Alfred Korzybski put it in his book Science and Sanity (1933), “The map is not the territory … The only usefulness of a map depends on similarity of structure between the empirical world and the map.” And I would add, in the ever-changing markets, we can judge that similarity of structure only after the fact.
See the menu page Analytical Methods for a rundown on where to go for information on Elliott wave analysis.
By Tim Bovee, Portland, Oregon, December 12, 2021
Disclaimer
Tim Bovee, Private Trader tracks the analysis and trades of a private trader for his own accounts. Nothing in this blog constitutes a recommendation to buy or sell stocks, options or any other financial instrument. The only purpose of this blog is to provide education and entertainment.
No trader is ever 100 percent successful in his or her trades. Trading in the stock and option markets is risky and uncertain. Each trader must make trading decisions for his or her own account, and take responsibility for the consequences.
License
All content on Tim Bovee, Private Trader by Timothy K. Bovee is licensed under a Creative Commons Attribution-ShareAlike 4.0 International License.
Based on a work at www.timbovee.com.

You must be logged in to post a comment.