3:30 p.m. New York time
Half an hour before the closing bell. The S&P 500 has fallen during the trading session, reach the 4590s. No change in the analysis. I’ve updated the chart.
9:35 a.m. New York time
What’s happening now? The S&P 500 E-mini futures continued to fall in overnight trading and at the opening bell had reached 4223.75 on the futures.
What does it mean? The decline strengthens the case for the uptrending correction that began on December 1 having ended on December 12, and that a new downtrend has begun from that peak, 4719.25. It is likely to reach the 4490s at a minimum.
What’s the alternative? Corrections sometimes create complex structures, linking two corrective patterns together. If that’s the case here, then I expect the decline to end above the 4490s, signaling the start of another corrective pattern within the larger rise that began on December 1.
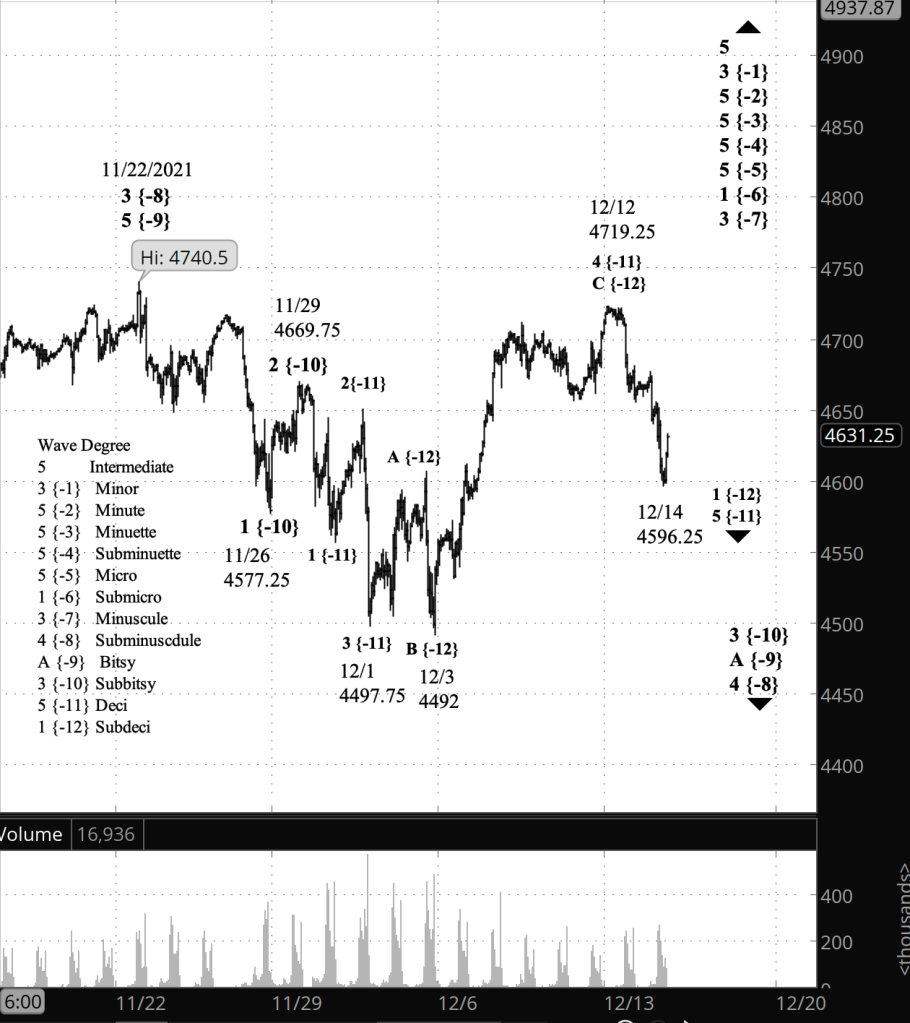
What does Elliott wave theory say? Under my principal analysis, uptrending wave 4 of Deci degree — subscript {-11} ended on December 12 and Deci wave 5 is now underway, internally tracing its 1st wave, of Subdeci degree {-12}. Wave 5 is tracing its downward course within the 3rd wave, of Subbitsy degree {-10}, within a larger downward correction, wave A of of Bitsy degree {-9}, the first wave within wave 4 of Subminuscule degree {-8}.
Under the alternative analysis, wave 4 of Deci degree is still underway, having completed a corrective pattern, and the present decline is wave X of Subdeci degree, which will, when complete, signal the start of another corrective pattern within wave 4.
Learning and other resources. Elliott wave analysis provides context, not prophecy. As the 20th century semanticist Alfred Korzybski put it in his book Science and Sanity (1933), “The map is not the territory … The only usefulness of a map depends on similarity of structure between the empirical world and the map.” And I would add, in the ever-changing markets, we can judge that similarity of structure only after the fact.
See the menu page Analytical Methods for a rundown on where to go for information on Elliott wave analysis.
By Tim Bovee, Portland, Oregon, December 14, 2021
Disclaimer
Tim Bovee, Private Trader tracks the analysis and trades of a private trader for his own accounts. Nothing in this blog constitutes a recommendation to buy or sell stocks, options or any other financial instrument. The only purpose of this blog is to provide education and entertainment.
No trader is ever 100 percent successful in his or her trades. Trading in the stock and option markets is risky and uncertain. Each trader must make trading decisions for his or her own account, and take responsibility for the consequences.
License
All content on Tim Bovee, Private Trader by Timothy K. Bovee is licensed under a Creative Commons Attribution-ShareAlike 4.0 International License.
Based on a work at www.timbovee.com.

You must be logged in to post a comment.