3:30 p.m. New York time
Half an hour before the closing bell. The S&P 500 futures continued to decline during the session, so far reaching a low of 4590. No change in the analysis. I’ve updated the upper chart.
12:45 p.m. New York time
Earnings play exit. I’ve exited my short iron condor position on FDX for a 19.4% return and have updated the analysis with full results.
9:50 a.m. New York time
My trades. The two short iron condor earnings plays I entered into yesterday, FDX and DRI, have overshot boundaries. FDX is showing a loss at present, and DRI a 9% profit. I shall wait a bit before exiting, in the hopes that the prices will return closer to their pre-announcement levels.
9:35 a.m. New York time
What’s happening now? The S&P 500 E-mini futures fell in overnight trading, reaching 4620.50 at the opening bell.
What does it mean? The decline marks a correction of the rise that began on December 3.
What’s the alternative? None so far today.
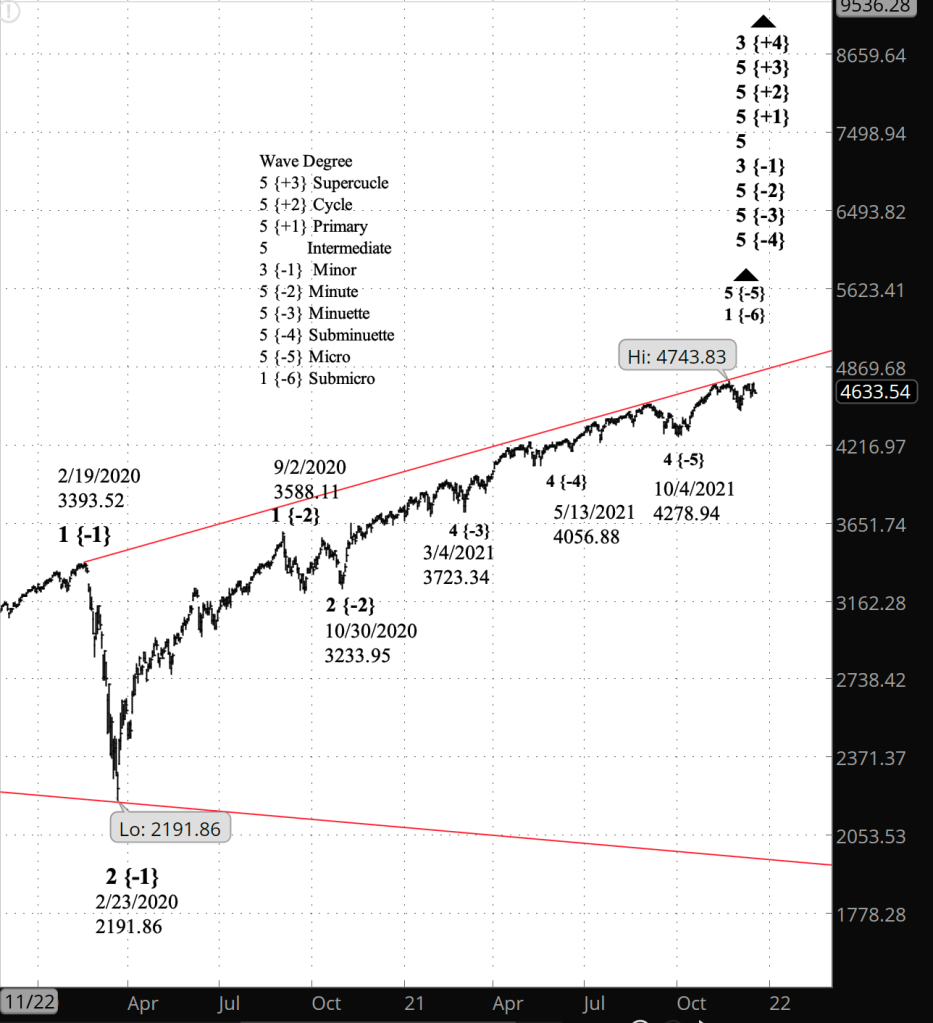
Charts. The upper chart is a close-up view beginning in late November. The lower chart is a long view, beginning in November 2019; it shows the early pandemic crash, and the redlines are the boundaries of an expanding Diagonal Triangle that began in December 2018.
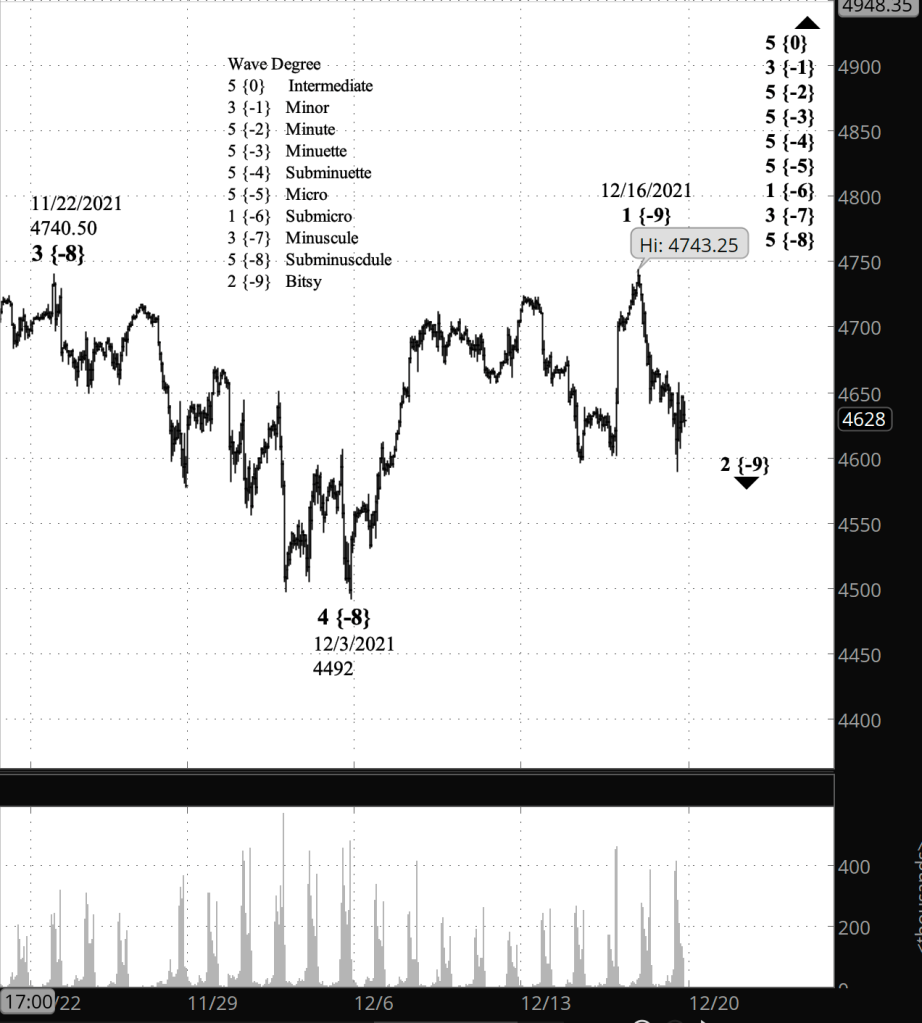
What does Elliott wave theory say? I reworked the count to correct some inelegancies in wave length, in particular the decline overnight, which feels much more like a 2nd wave than a 4th.
Under my principal analysis, wave 2 of Bitsy degree — subscript {-9} — is underway and appears to be close to completing its first internal wave, A of Subbitsy degree {-10}. The structure is part of wave 5 of Subminuscule degree {-8}, which began on December 3.
Moving up the chain, the parent of Subminuscule 5 is wave 3 of Minscule degree {-7}, and the completion of Subminuscule 5 will mark the beginning of a 4th-wave correction at the Minuscule degree.
No change in the big picture. Wave of 1 of Submicro degree {-6} is still underway. Its parent, wave 5 of Micro degree {-5}, is the first in a line of 5th degrees stretching up to wave 5 of Minute degree {-2} within wave 3 of Minor degree {-1}.
Learning and other resources. Elliott wave analysis provides context, not prophecy. As the 20th century semanticist Alfred Korzybski put it this way in his book Science and Sanity (1933), “The map is not the territory … The only usefulness of a map depends on similarity of structure between the empirical world and the map.” And I would add, in the ever-changing markets, we can judge that similarity of structure only after the fact.
See the menu page Analytical Methods for a rundown on where to go for information on Elliott wave analysis.
By Tim Bovee, Portland, Oregon, December 17, 2021
Disclaimer
Tim Bovee, Private Trader tracks the analysis and trades of a private trader for his own accounts. Nothing in this blog constitutes a recommendation to buy or sell stocks, options or any other financial instrument. The only purpose of this blog is to provide education and entertainment.
No trader is ever 100 percent successful in his or her trades. Trading in the stock and option markets is risky and uncertain. Each trader must make trading decisions for his or her own account, and take responsibility for the consequences.
License
All content on Tim Bovee, Private Trader by Timothy K. Bovee is licensed under a Creative Commons Attribution-ShareAlike 4.0 International License.
Based on a work at www.timbovee.com.

You must be logged in to post a comment.