3:30 p.m. New York time
Half an hour before the closing bell. The S&P 500 continued its downward course throughout the day, with no significant upward moves. The low point attained so far is 4520.25 on the futures, 4531.10 on the index.
If the price reaches below 4492 on the futures, the starting point of uptrending wave 1 of Bitsy degree, which preceded the present wave 2 decline, then the principal analysis will need to be redone, since under the rules of Elliott wave analysis, if a “2nd wave” moves beyond the start of the preceding 1st wave, then it isn’t a 2nd wave.
No change in the analysis, and I’ve updated the chart.
2:35 p.m. New York time
Another earnings play. I’ve entered a short iron condor earnings play on GIS and have posted an analysis.
2:20 p.m. New York time
Earnings plays. I’ve entered two earnings plays today, short iron condors on two stocks, and have posted analyses for both MU and NKE. A third earnings play, on GIS, has not yet been filled.
10:35 a.m. New York time
My trades. I exited my short bear call spread position on SPY for a 131.5% profit and have updated the analysis with results.
9:35 a.m. New York time
What’s happening now? The S&P 500 E-mini futures declined after trading resumed on Sunday, to 4526.25, and then, shortly before midnight, reversed in a so-far small rise.
What does it mean? The first leg of the downward correction that began on December 16 continues and will be followed by a rise to new heights, beyond the 4743.25 attained on that date.
What’s the alternative? The overnight low could have marked the end of correction, but the internal structure suggests otherwise. Also, the high of December 16 could mark the end of the rise that began on December 3, and the subsequent decline in that case would be the beginning of a new downtrend.
Divergence. The present count is based on the all-time high set on December 16 by the futures. However, for the S&P 500 index, which fluctuates only during normal U.S. market hours, the highest high remains that set on November 22, at 4743.83. The highest high for SPY, the exchange-traded fund that tracks the index, was also set on November 22, at 473.54.
In the past such divergences have eventually ended, with the index and the ETF catching up with the futures, which trade 24/7 Sunday evening through Friday afternoon. I’ve seen analysts claim that the three products can be analyzed as separate entities, but I don’t buy that. They’re tracking the same collection of stocks, and any divergence is simply an artifact of the trading schedule. In my analysis, I consider the constantly traded futures to be the best reflection of the public mood’s impact on the S&P 500.
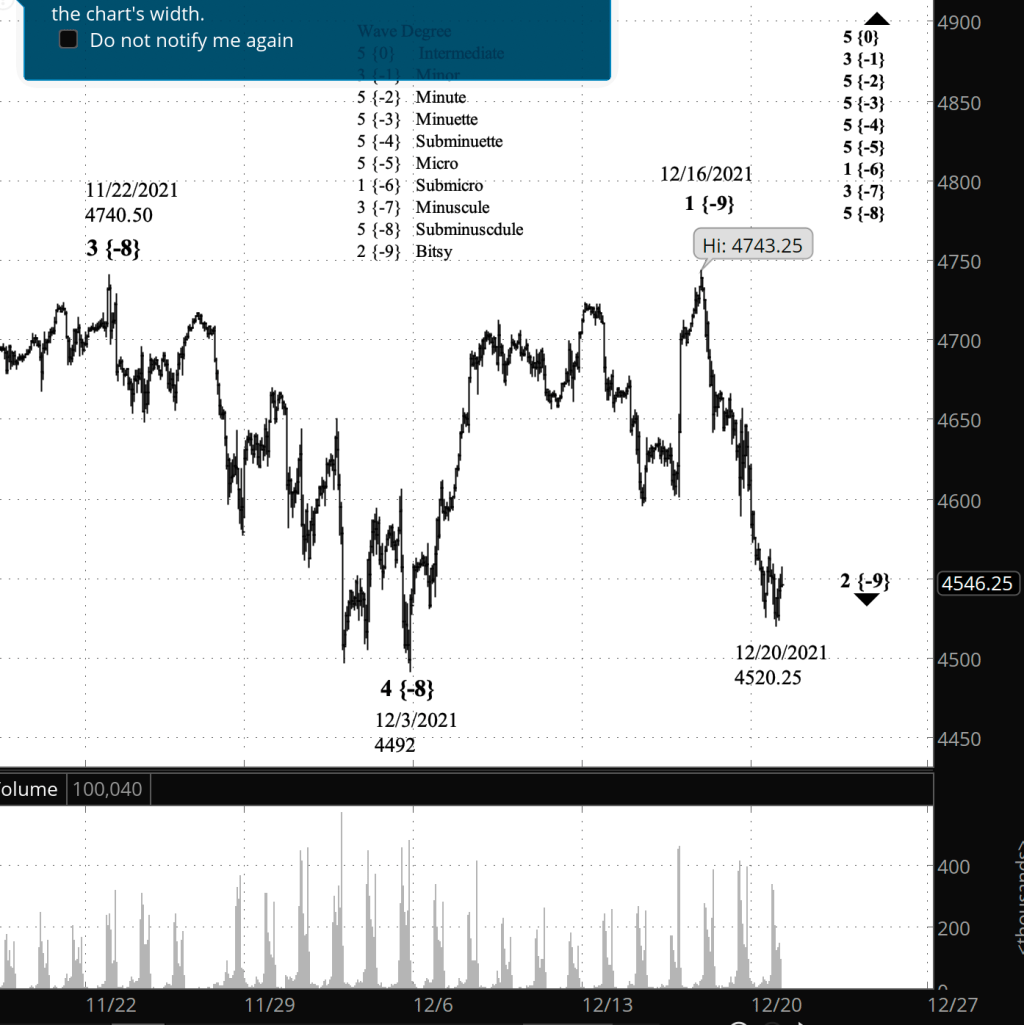
What does Elliott wave theory say? Under my principal analysis, I’ve labeled the decline from the December 16 high as wave 2 of Bitsy degree {-9} within rising wave 5 of Subminuscule degree {-8}. But Bitsy 2 could well be a degree lower.
Under the first alternative, Bitsy 2 ended with the Sunday night low. Under the second alternative, the December 16 high marked the end of wave 5 of Subminuscule degree, and the subsequent decline is wave 1 of a new downtrend that will carry the price significantly lower.
Earnings plays. I’ll be looking at three earnings plays today: MU, NKE and GIS.
Learning and other resources. Elliott wave analysis provides context, not prophecy. As the 20th century semanticist Alfred Korzybski put it this way in his book Science and Sanity (1933), “The map is not the territory … The only usefulness of a map depends on similarity of structure between the empirical world and the map.” And I would add, in the ever-changing markets, we can judge that similarity of structure only after the fact.
See the menu page Analytical Methods for a rundown on where to go for information on Elliott wave analysis.
By Tim Bovee, Portland, Oregon, December 20, 2021
Disclaimer
Tim Bovee, Private Trader tracks the analysis and trades of a private trader for his own accounts. Nothing in this blog constitutes a recommendation to buy or sell stocks, options or any other financial instrument. The only purpose of this blog is to provide education and entertainment.
No trader is ever 100 percent successful in his or her trades. Trading in the stock and option markets is risky and uncertain. Each trader must make trading decisions for his or her own account, and take responsibility for the consequences.
License
All content on Tim Bovee, Private Trader by Timothy K. Bovee is licensed under a Creative Commons Attribution-ShareAlike 4.0 International License.
Based on a work at www.timbovee.com.

You must be logged in to post a comment.