3:30 p.m. New York time
Half an hour before the closing bell. The S&P 500 rose during the trading session, reaching the 50% retracement level as the closing bell approached. Uptrending wave 5 of Bitsy degree {-9} continues.
2:25 p.m. New York time
New earnings play. I’ve entered an earnings play on PAYX and have posted an analysis of the trade.
9:35 a.m. New York time
What’s happening now? The S&P 500 E-mini futures rose overnight, so far retracing 38.2% of the decline that began on August 16 from a peak of 4743.25.
What does it mean? The correction that began on August 16 ended yesterday at 4520.25, and a rise that will ultimately reach new heights, beyond 4743.25, has begun.
What’s the alternative? Yesterday’s low can be read as being the end of the first leg of the correction, with the subsequent rise ending below 4743.25. That middle leg would be followed be a decline, perhaps approaching 4500.
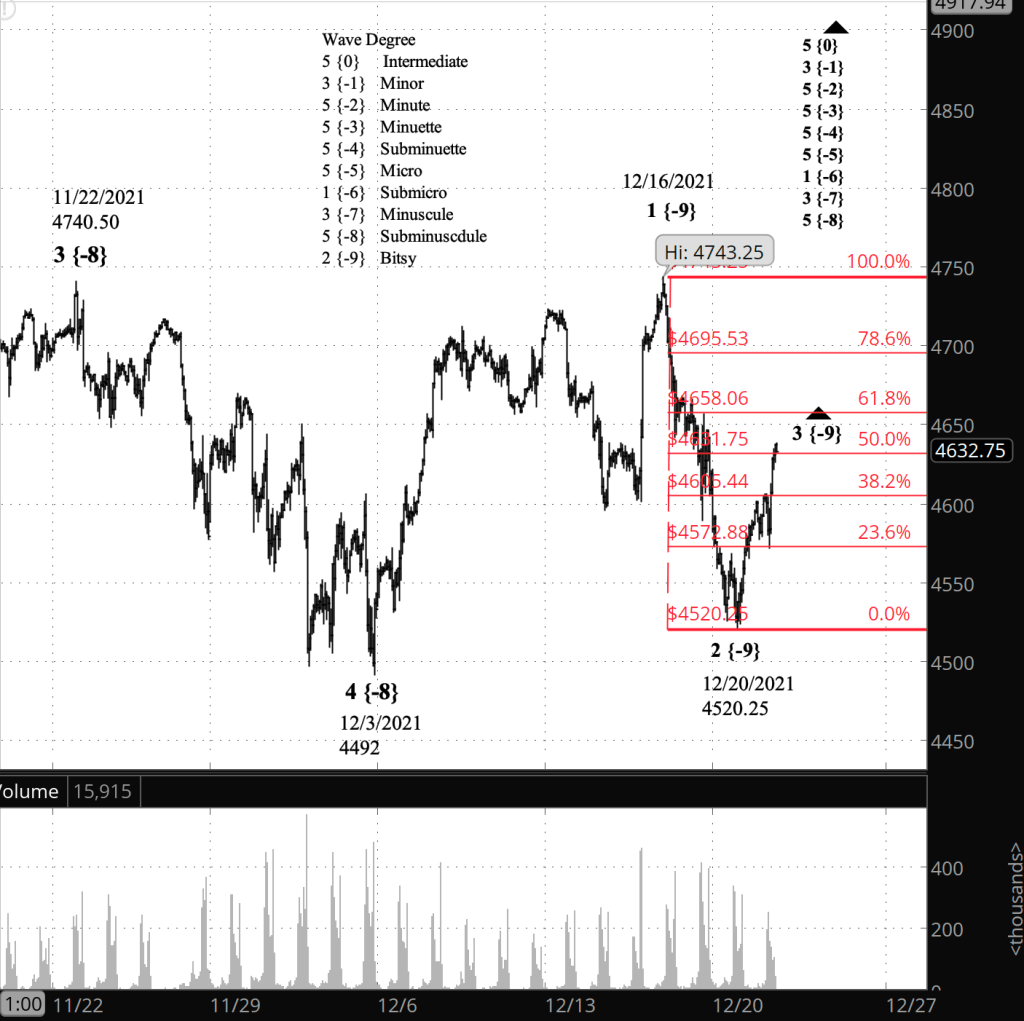
What does Elliott wave theory say? Under my principal analysis, the decline from August 16 was wave 2 of Bitsy degree — subscript {-9} and has three waves internally, the number needed for completion. The rise from last night is wave 3 of Bitsy degree and will exhibit the power for which 3rd waves are famous. It will rise beyond the end of the preceding wave 1 of Bitsy degree, 4743.25, and typically quite a bit above that level.
The alternative analysis would read Bitsy wave 2 as so far having completed the 1st of its three waves, wave A, with the subsequent rise, wave B, coming up short of the beginning of Bitsy wave 1 before falling again in a C wave.
The retracement overnight paused at 38.2%, a Fibonacci level. (The Fibonacci ladder is on the chart in red.)
This is all happening within wave 5 of Subminuscule degree {-8}, whose completion will also mark the end of its parent, wave 3 of Minuscule degree. The subsequent 4th wave will be a downward correction larger than the correction we’ve just completed.
Trading plans. I’ll be taking a look at PAYX today as a potential earnings play.
Learning and other resources. Elliott wave analysis provides context, not prophecy. As the 20th century semanticist Alfred Korzybski put it this way in his book Science and Sanity (1933), “The map is not the territory … The only usefulness of a map depends on similarity of structure between the empirical world and the map.” And I would add, in the ever-changing markets, we can judge that similarity of structure only after the fact.
See the menu page Analytical Methods for a rundown on where to go for information on Elliott wave analysis.
By Tim Bovee, Portland, Oregon, December 21, 2021
Disclaimer
Tim Bovee, Private Trader tracks the analysis and trades of a private trader for his own accounts. Nothing in this blog constitutes a recommendation to buy or sell stocks, options or any other financial instrument. The only purpose of this blog is to provide education and entertainment.
No trader is ever 100 percent successful in his or her trades. Trading in the stock and option markets is risky and uncertain. Each trader must make trading decisions for his or her own account, and take responsibility for the consequences.
License
All content on Tim Bovee, Private Trader by Timothy K. Bovee is licensed under a Creative Commons Attribution-ShareAlike 4.0 International License.
Based on a work at www.timbovee.com.

You must be logged in to post a comment.