3:30 p.m. New York time
Half an hour before the closing bell. The S&P 500 futures fell more than 40 points during the day and then reversed, remaining below the peak set this morning, 4808.25. No change in the analysis. I’ve updated the chart.
10:55 a.m. New York time
Options trades? Not today. I attempted to build vertical options spreads for the five prospects listed below. None of them worked out to my satisfaction: Too much risk for too little reward. So I’m rejecting them all and will reserve my funds for earnings plays. The 4th quarter of 2021 earnings announcements will begin in earnest the week beginning January 16, with two early prospects lined up for Wednesday.
10 a.m. New York time
Trades today. I’ve bought shares of ABG, which has been rated “strong buy” according to Zacks‘ reading of analyst opinion. This is the optimal day to enter options positions expiring February 18, and I’ll be looking at five prospects: FXI, NIO, EWZ, XBI and FXE.
9:35 a.m. New York time
What’s happening now? The S&P 500 E-mini futures rose to a new peak, 4807.50, in overnight trading.
What does it mean? The low-level correction that had been underway since December 30 ended on Monday, and a push to the upside has begun. It is the last leg of the rise that began on December 20.
What’s the alternative? None in sight at the moment. Which isn’t to say that ambiguities won’t develop.
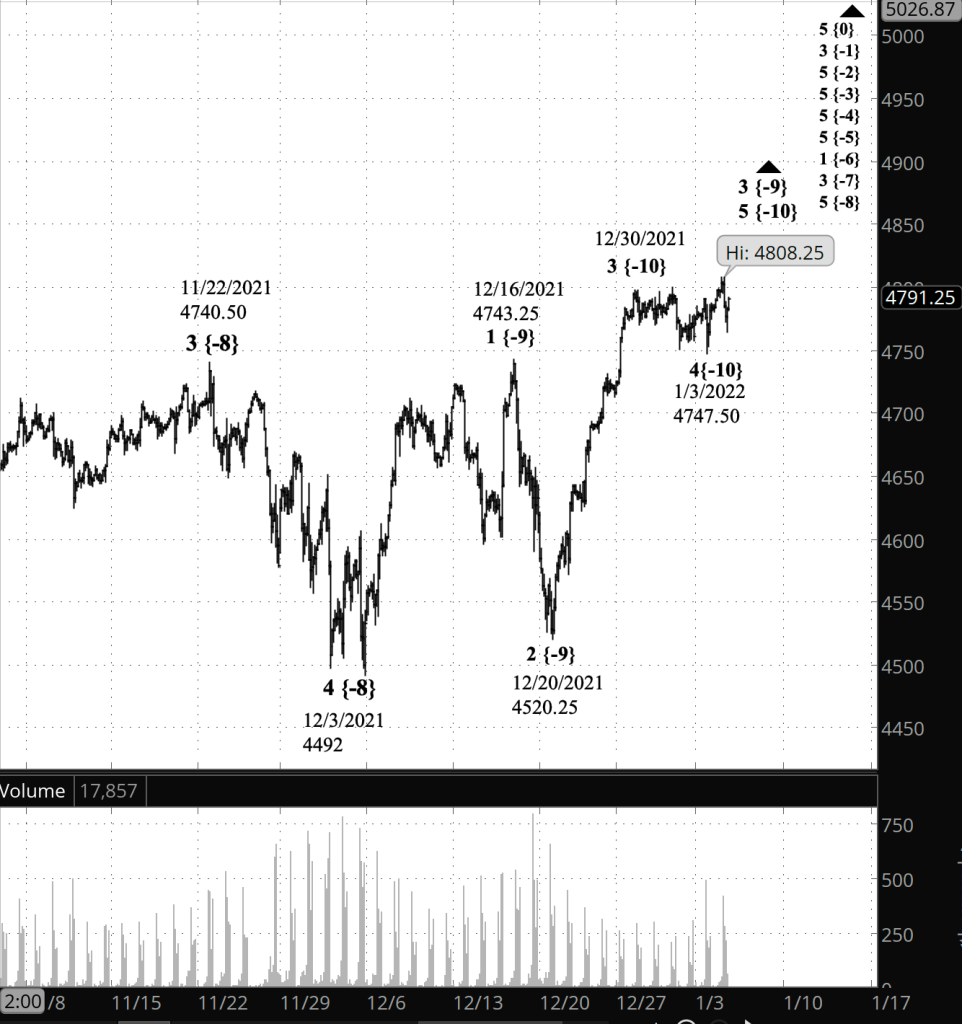
What does Elliott wave theory say? The rise that began on January 3 is wave 5 {-10} within wave 3 {-9}, which in turn is a subwave of the rise that began on December 3 from 4492: Wave 5 {-8}. When 3 {-9} is complete, it will be followed by a 4th wave correction, and then an even greater push to new heights, wave 5 {-9}.The completion of 5 {-9} will mark the end of wave 5 {-8} and, one degree higher, of wave 3 {-7}.
Learning and other resources. Elliott wave analysis provides context, not prophecy. As the 20th century semanticist Alfred Korzybski put it this way in his book Science and Sanity (1933), “The map is not the territory … The only usefulness of a map depends on similarity of structure between the empirical world and the map.” And I would add, in the ever-changing markets, we can judge that similarity of structure only after the fact.
See the menu page Analytical Methods for a rundown on where to go for information on Elliott wave analysis.
By Tim Bovee, Portland, Oregon, January 4, 2022
Disclaimer
Tim Bovee, Private Trader tracks the analysis and trades of a private trader for his own accounts. Nothing in this blog constitutes a recommendation to buy or sell stocks, options or any other financial instrument. The only purpose of this blog is to provide education and entertainment.
No trader is ever 100 percent successful in his or her trades. Trading in the stock and option markets is risky and uncertain. Each trader must make trading decisions for his or her own account, and take responsibility for the consequences.
License
All content on Tim Bovee, Private Trader by Timothy K. Bovee is licensed under a Creative Commons Attribution-ShareAlike 4.0 International License.
Based on a work at www.timbovee.com.

You must be logged in to post a comment.