3:30 p.m. New York time
Half an hour before the closing bell. The S&P 500 took a sharp turn to the downside. I’m promoting my alternative analysis to principal and interpreting the decline to mean that wave 4 {-10} is still underway. This 4th wave is a downward correction within uptrending wave 3 {-9} within uptrending wave 5 {-8}. I’ve updated the chart to reflect the changes in my analysis.
2:40 p.m. New York time
Earnings play on LW. I’ve entered a short iron condor position on WBA timed to coincide with tomorrow morning’s earnings announcement and have posted an analysis of the trade.
2:15 p.m. New York time
Earnings play on WBA. I’ve entered a short iron condor position on WBA timed to coincide with tomorrow morning’s earnings announcement and have posted an analysis of the trade.
1:15 p.m. New York time
Earnings play on CAG. I’ve entered a short iron condor position on CAG timed to coincide with tomorrow morning’s earnings announcement and have posted an analysis of the trade.
10 a.m. New York time
Trades today. I’ll be looking at three earnings plays using options: A bull put spread on LW, a bear call spread on CAG, and possibly an iron condor on WBA. I looked at a long shares earnings play on STZ, but directionally it looks like a downward move to me so I’m passing. STZ has options, but it isn’t liquid enough to meet my standards. I’ll be posting analyses of the options trades as they are placed.
9:35 a.m. New York time
What’s happening now? The S&P 500 E-mini futures rose slightly in overnight trading.
What does it mean? The rise that began on January 3 continues, within the larger uptrend that began on December 20.
What’s the alternative? The correction that began on December 30 could still be underway. A push of the futures above the January 4 high, 4808.25, will eliminate this alternative analysis and confirm the principal analysis.
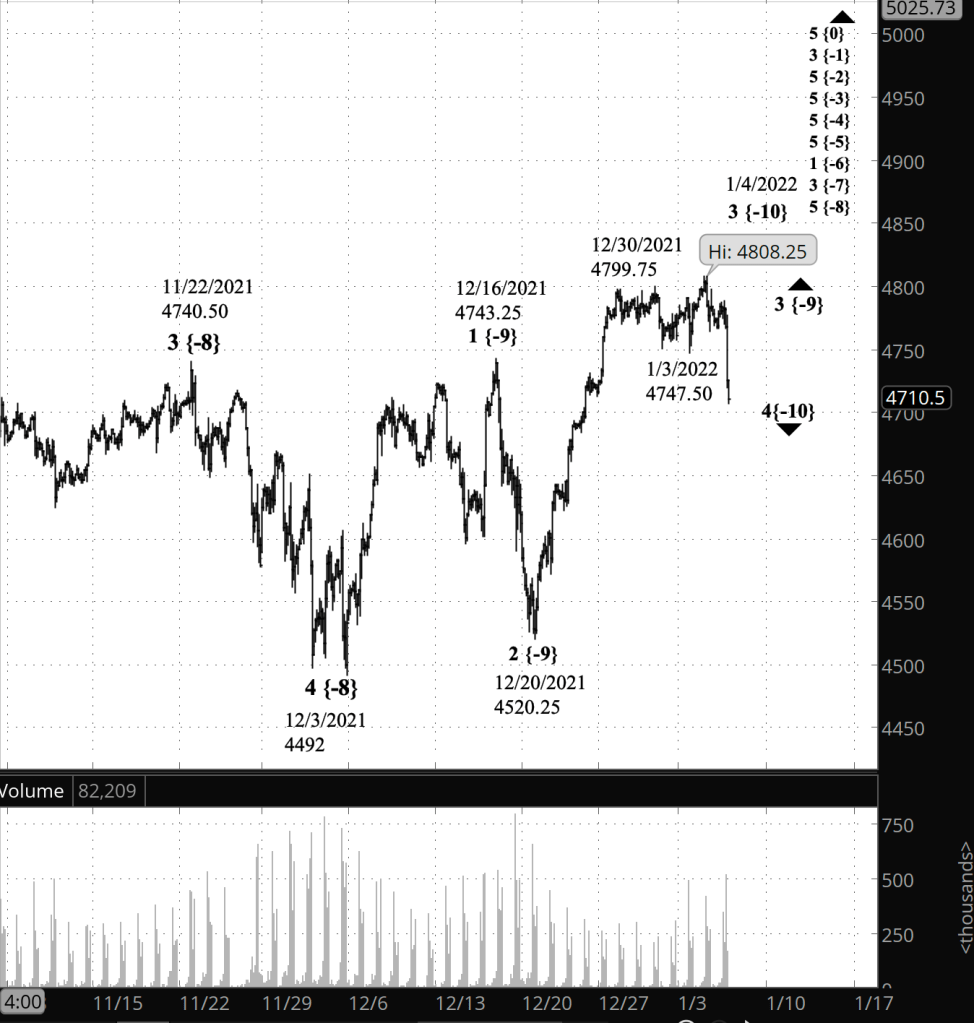
What does Elliott wave theory say? Under the principal analysis, wave 5 {-10} began on January 3 and is still taking its early, tentative steps. It will rise above 4808.25 — the January 4 high — perhaps significantly above that level.
This is all happening with wave 3 {-9}, which began on December 20, and one degree higher, within wave 5 {-8} which began on December 3 from 4492.
The alternative analysis recognizes that wave 4 {-10}, the correction that began on January 3, could still be underway. Only when the price rises above 4808.25 will this possibility be eliminated.
Learning and other resources. Elliott wave analysis provides context, not prophecy. As the 20th century semanticist Alfred Korzybski put it this way in his book Science and Sanity (1933), “The map is not the territory … The only usefulness of a map depends on similarity of structure between the empirical world and the map.” And I would add, in the ever-changing markets, we can judge that similarity of structure only after the fact.
See the menu page Analytical Methods for a rundown on where to go for information on Elliott wave analysis.
By Tim Bovee, Portland, Oregon, January 5, 2022
Disclaimer
Tim Bovee, Private Trader tracks the analysis and trades of a private trader for his own accounts. Nothing in this blog constitutes a recommendation to buy or sell stocks, options or any other financial instrument. The only purpose of this blog is to provide education and entertainment.
No trader is ever 100 percent successful in his or her trades. Trading in the stock and option markets is risky and uncertain. Each trader must make trading decisions for his or her own account, and take responsibility for the consequences.
License
All content on Tim Bovee, Private Trader by Timothy K. Bovee is licensed under a Creative Commons Attribution-ShareAlike 4.0 International License.
Based on a work at www.timbovee.com.

You must be logged in to post a comment.