3:30 p.m. New York time
Half an hour before the closing bell. The S&P 500 rose to the 23.6% Fibonacci retracement level and then pulled back slightly. The movement was the third wave within wave B{-10} and fulfilled all requirements for completion of the B wave. The price could go higher, but under my principal analysis, can’t go above 4808.25, the January 4 peak. No change in the analysis from this morning, beyond the correction noted below. I’ve updated the chart.
2:47 p.m. New York time
Correction. I’ve updated the chart to correct the labelling of the rise that began January 10 and have corrected the designation in the first paragraph of the Elliott wave theory text below the chart.
10:15 a.m. New York time
Earnings play. I’ve opened a short iron condor position on DAL prior to the airlines’ earnings announcement on Thursday before the opening bell. The stock is ranked as “Hold” by Zacks, so I went with an iron condor. Zacks’ Earnings Surprise Predictor is 64% for a positive surprise, which is quite high. The implied volatility rank is lower than I like, but I was able to construct a trade that provided sufficient premium to meet my requirements. I’ve posted an analysis of the trade.
No earnings plays using stocks in sight today.
9:35 a.m. New York time
What’s happening now? The S&P 500 E-mini futures continued to rise in overnight trading, again approaching the 23.6% Fibonacci retracement level.
What does it mean? The second leg of a downward correction that began January 4 is still underway. A move above the January 4 high of 4808.25 would require that the analysis be revised.
What are the alternatives? The 2nd leg of a new downtrend that began January 4 is still underway. It presently has three segments internally. If another decline and rise are added, then this analysis would be invalidated.
Another alternative: The correction that began January 4 ended on January 10 at 4572.75, and the rise that followed is the first leg of a renewed uptrend. A move above 4808.25 would confirm this analysis. A move below 4572.75 would invalidate it. Also, to count decline from January 4 to 10 as having three legs internally — a necessity for this scenario — requires some creative viewing of the chart to make it work. I consider this to be the least likely scenario.
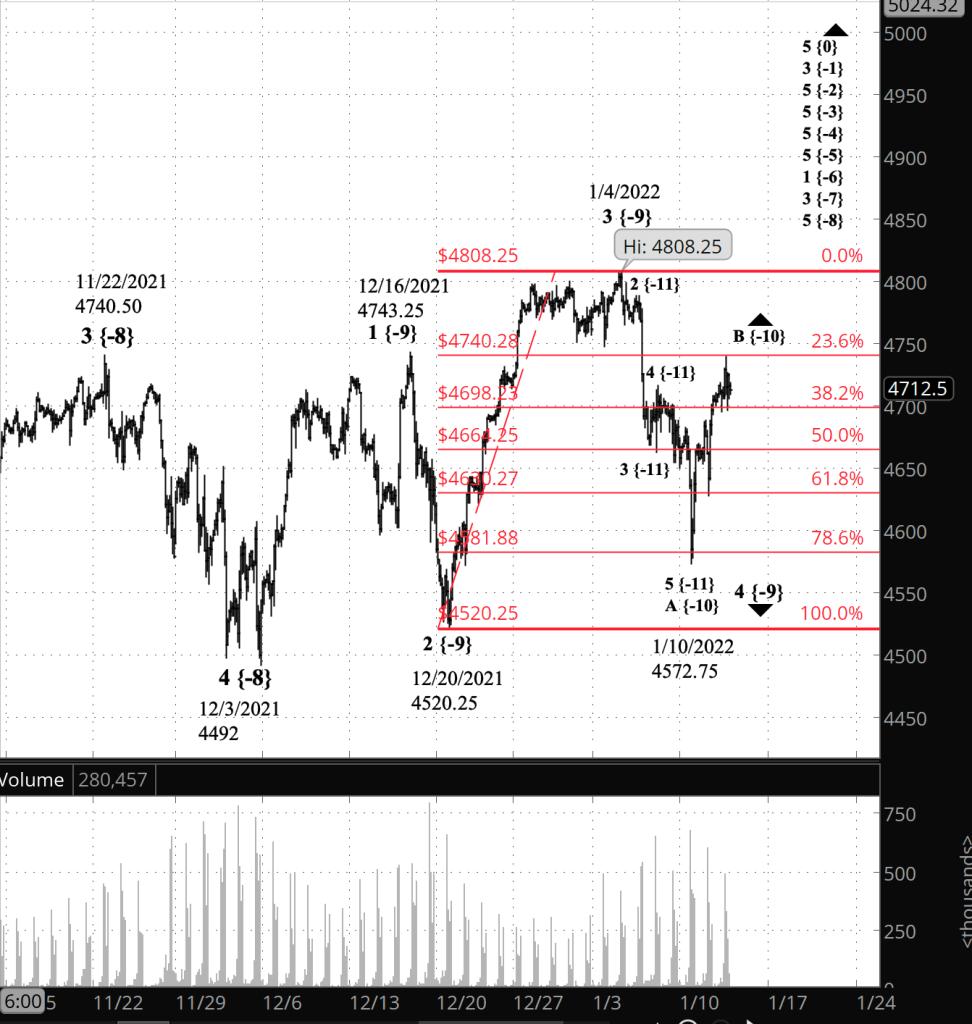
What does Elliott wave theory say? Under my principal analysis, the rise from January 10 is upward wave B{-10} [corrected from the initial post] within downward correction wave 4{-9}.
Under the first alternative analysis, the rise from January 10 is an upward correction, wave 2{-10}, within downtrending wave 1{-9}. The second wave must have three waves internally, unless it adds a second corrective pattern in a compound structure, which is not some common in second waves.
Under the second alternative, the low of January 10 ended downward wave C{-10} within downward correction wave 4{-9}, and the subsequent rise is uptrending wave 1{-10} within uptrending wave 5{-9}.
All of these scenarios, whichever map ends up conforming to the territory, are happening within uptrending wave 5{-8}, which began on December 3 from 4492.
Learning and other resources. Elliott wave analysis provides context, not prophecy. As the 20th century semanticist Alfred Korzybski put it this way in his book Science and Sanity (1933), “The map is not the territory … The only usefulness of a map depends on similarity of structure between the empirical world and the map.” And I would add, in the ever-changing markets, we can judge that similarity of structure only after the fact.
See the menu page Analytical Methods for a rundown on where to go for information on Elliott wave analysis.
By Tim Bovee, Portland, Oregon, January , 2022
Disclaimer
Tim Bovee, Private Trader tracks the analysis and trades of a private trader for his own accounts. Nothing in this blog constitutes a recommendation to buy or sell stocks, options or any other financial instrument. The only purpose of this blog is to provide education and entertainment.
No trader is ever 100 percent successful in his or her trades. Trading in the stock and option markets is risky and uncertain. Each trader must make trading decisions for his or her own account, and take responsibility for the consequences.
License
All content on Tim Bovee, Private Trader by Timothy K. Bovee is licensed under a Creative Commons Attribution-ShareAlike 4.0 International License.
Based on a work at www.timbovee.com.

You must be logged in to post a comment.