3:30 p.m. New York time
Half an hour before the closing bell. The S&P 500 has continued to work its way higher during the trading session, returning to the 38.2% Fibonacci retracement level. No change in the analysis. I’ve updated the chart.
3:15 p.m. New York time
Earnings play exited. I’ve exited my short iron condor position on CAG, six days after entering the position the day before the earnings announcement, for a return of 32.8%, or 1,998% annualized. I’ve updated the analysis with full results.
10:05 a.m. New York time
My trades. Actually, no trades today. JEF publishes earnings on Wednesday before the opening bell. I’ve done the options analysis, and JEF doesn’t provide sufficient return to support the position. The implied volatility rank is relatively low for this close to an earnings announcement, only 29.2%. I always prefer that my short options position be at 30% or above. Zacks expects no earnings surprise in either direction, so the position would be structured as a short iron condor. A construction covering the expected move based on options pricing: $1.11 in either direction, or $39.60 to $41.82, provides 28% coverage of the long-short intervals of the two legs of the iron condor. I prefer 33% or better. And the risk/reward ratio is 2.6:1, which is higher risk than I prefer with iron condors. Generally, my preference is for a ratio better than 1.5:1. A stock trade for JEF is also out of the picture; I trade stocks on earnings only when the Zacks Expected Surprise Prediction for earnings is greater than zero, and that’s not the case for JEF.
No other trades in sight today.
9:35 a.m. New York time
What’s happening now? The S&P 500 E-mini futures continued to rise in overnight trading, moving back above the 50% retracement of the rise from December 20 to January 4.
What does it mean? The rise is the second leg of a correction from the January 4 peak.
What’s the alternative? The rise is the second leg of a downtrend that began on January 4.
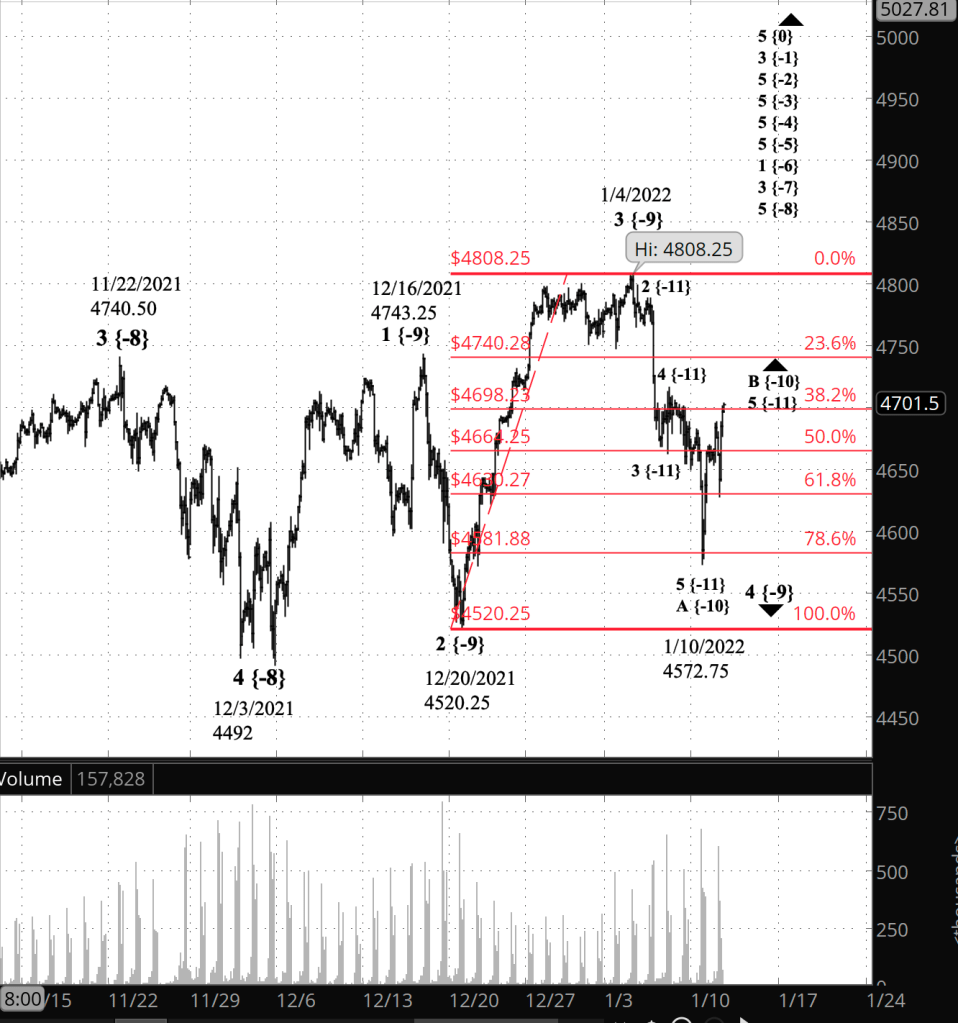
What does Elliott wave theory say? Under my principal analysis, the decline from January 4 — the end of wave 3{-9} to January 10 is wave A{-10}, the first wave of a three-wave downward correction. wave B{-10} will carry the price up but will remain bellow the January 4 high of 4808.25.
Under my alternative analysis, the January 4 to January 10 decline was wave 1{10} of an impulse wave, a new trend to the downside. The subsequent rise is wave 2{-10} The January 4 peak was the end of wave 5{-9} under this scenario.
Under both scenarios, the first wave can have five subwaves (as it has) and the second wave, three subwaves (as it almost certainly will). So the rise won’t clear up the present ambiguity about whether the S&P 500 is in a correction or a new downtrend.
See the Ellliott wave theory section of yesterday’s Trader’s Notebook for an extensive discussion of the possibilities.
Learning and other resources. Elliott wave analysis provides context, not prophecy. As the 20th century semanticist Alfred Korzybski put it this way in his book Science and Sanity (1933), “The map is not the territory … The only usefulness of a map depends on similarity of structure between the empirical world and the map.” And I would add, in the ever-changing markets, we can judge that similarity of structure only after the fact.
See the menu page Analytical Methods for a rundown on where to go for information on Elliott wave analysis.
By Tim Bovee, Portland, Oregon, January 11, 2022
Disclaimer
Tim Bovee, Private Trader tracks the analysis and trades of a private trader for his own accounts. Nothing in this blog constitutes a recommendation to buy or sell stocks, options or any other financial instrument. The only purpose of this blog is to provide education and entertainment.
No trader is ever 100 percent successful in his or her trades. Trading in the stock and option markets is risky and uncertain. Each trader must make trading decisions for his or her own account, and take responsibility for the consequences.
License
All content on Tim Bovee, Private Trader by Timothy K. Bovee is licensed under a Creative Commons Attribution-ShareAlike 4.0 International License.
Based on a work at www.timbovee.com.

You must be logged in to post a comment.