3:30 p.m. New York time
Half an hour before the closing bell. The S&P 500 futures spent the day crossing and recrossing the 23.6% retracement level. Just as a rough guess, based on several waves that don’t really go anywhere, each with three internal waves, wave C{-11} might well be taking the form of a Triangle, perhaps a Descending Triangle (flat lower boundary and descending upper boundary). At this point, though, it’s quite ambiguous, and I’m not proposing it as my principal analysis, which is unchanged this afternoon. I’ve updated the chart.
11:20 a.m. New York time
AAPL earnings play exit. I’ve exited my short bull put options spread on AAPL the day after entering the position as an earnings play. The return was 32.5%. I’ve updated the trade analysis with the result.
9:35 a.m. New York time
What’s happening now? The S&P 500 E-mini futures again declined below the 23.6% Fibonacci retracement level, with the overnight low, 4266.25, coming with 54 points of the January 24 low. The price then rose slightly as the opening bell approached.
What does it mean? The upward correction that began on January 24 from 4212.75 is still underway and is now in its 3rd and possibly final leg.
What are the alternatives? There are two.
Alternative #1: It’s possible that yesterday’s high just above the 38.2% Fibonacci retracement was the end of the correction, although the internal structure of the rise to that high point doesn’t appear to support such a reading of the chart with a great degree of clarity. Nonetheless, it’s conceivable.
Alternative #2: Although corrections come with three waves internally, there are variations. It’s possible that the present correction will form a compound structure, attaching a second corrective pattern to the first.
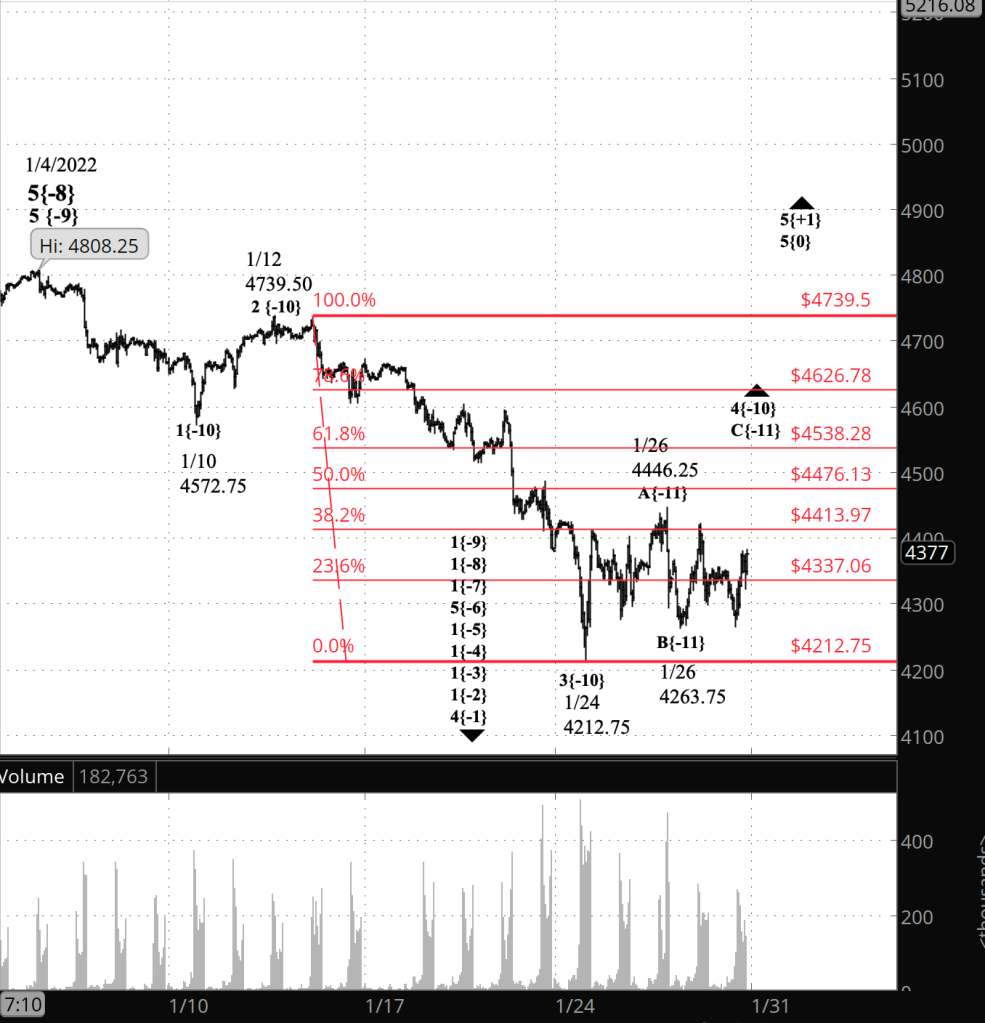
What does Elliott wave theory say? Under the principal analysis rising wave C{-11} within the upward wave 4{-10} correction is still underway.
Alternative #1: C waves in a Flat — the pattern of the present correction — have five waves internally. I can only count three in wave C{-11}, with a very minuscule correction in the middle. Nonetheless, if I squint real hard, it can be counted as five waves.
Alternative #2: If the wave 4{-10} correction expands into a complex pattern, then wave C{-11} will be followed by an X-wave, which will connect the two patterns, and then by a second corrective pattern.
Learning and other resources. Elliott wave analysis provides context, not prophecy. As the 20th century semanticist Alfred Korzybski put it this way in his book Science and Sanity (1933), “The map is not the territory … The only usefulness of a map depends on similarity of structure between the empirical world and the map.” And I would add, in the ever-changing markets, we can judge that similarity of structure only after the fact.
See the menu page Analytical Methods for a rundown on where to go for information on Elliott wave analysis.
By Tim Bovee, Portland, Oregon, January 28, 2022
Disclaimer
Tim Bovee, Private Trader tracks the analysis and trades of a private trader for his own accounts. Nothing in this blog constitutes a recommendation to buy or sell stocks, options or any other financial instrument. The only purpose of this blog is to provide education and entertainment.
No trader is ever 100 percent successful in his or her trades. Trading in the stock and option markets is risky and uncertain. Each trader must make trading decisions for his or her own account, and take responsibility for the consequences.
License
All content on Tim Bovee, Private Trader by Timothy K. Bovee is licensed under a Creative Commons Attribution-ShareAlike 4.0 International License.
Based on a work at www.timbovee.com.

[…] What are the alternatives? There are two, unchanged from Friday’s Notebook. […]
LikeLike