3:30 p.m. New York time
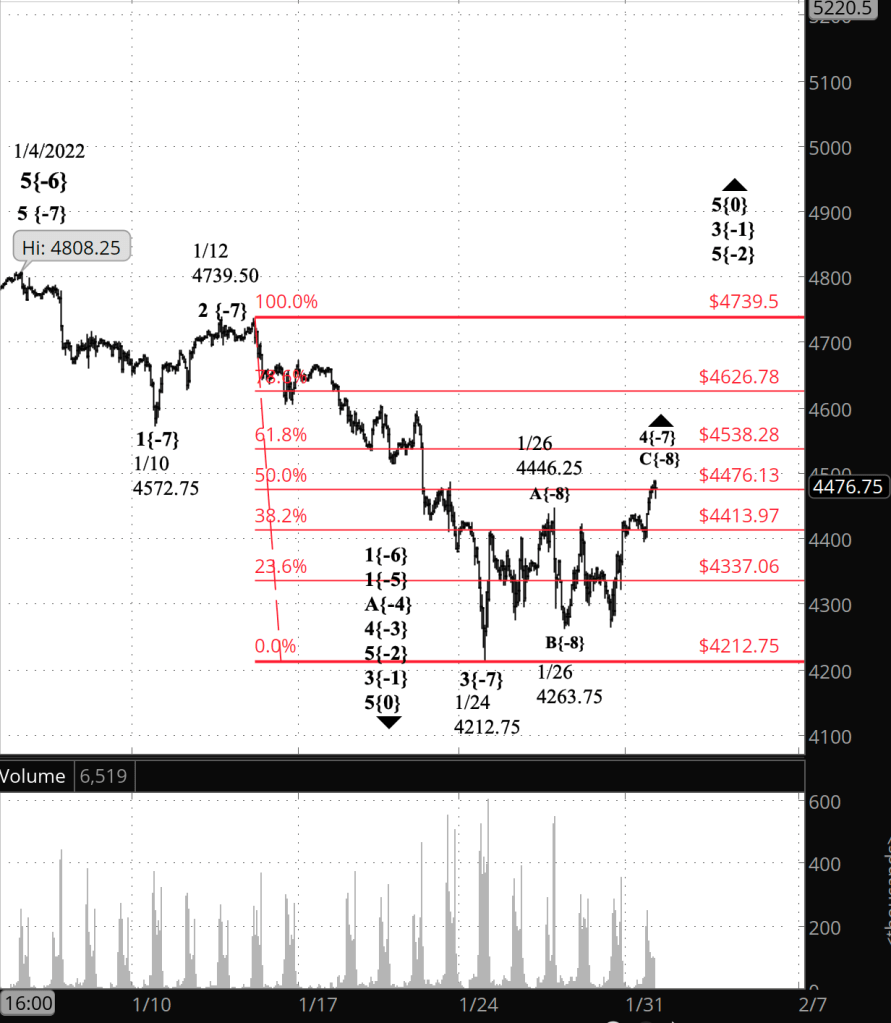
Half an hour before the closing bell. The S&P 500 futures pushed up to the 50% retracement level and again paused. The upward movement invalidates my first alternative from this morning, that the retracement had ended overnight. The present high of the session meets all of the requirements for completing the wave 4{-7}, the upward correction that began January 24. Under the rules of Elliott wave analysis, it could still rise further, but it must remain below the end of the preceding 1st wave, 4572.75. No change in the principal analysis. I’ve updated the chart.
11:30 a.m. New York time
XOM earnings play entry. I’ve entered a short bull put options vertical spread on XOM, timed to coincide with the company’s earnings announcement tomorrow before the opening bell. I’ve posted an analysis of the trade.
9:35 a.m. New York time
What’s happening now? The S&P 500 E-mini futures traded within a narrow range in overnight trading, staying close to the 38.2% Fibonacci retracement level.
What does it mean? The correction that began on January 24 continues and is now in its 4th leg within a five-leg pattern.
What are the alternatives? There are two, unchanged from Friday’s Notebook.
Alternative #1: It’s possible that the correction ended at the overnight peak. The internal structure of the rise to that high doesn’t appear to support such a reading of the chart. However, I can’t rule it out entirely.
Alternative #2: Corrections come with three waves internally, and this correction is now in its 3rd wave. However, it’s possible that the present correction will form a compound structure, with two corrective patterns connected by an intervening decline and rise.
What does Elliott wave theory say? Over the weekend I did an inventory of the Elliott waves I’ve identified within wave 5{0} — the Intermediate degree in the traditional naming — which began on December 21, 2018 from 2316.75 on the futures. In doing so I identified a few long-ago inelegancies enabled me to improve the count. As a result of that work, I’ve changed the degree level of the present-day chart, raising the degrees up three levels. What was wave C{-11} on Friday’s chart is now wave C{-8} on today’s chart, and other waves have had a corresponding adjustment.
Nothing significant has changed. The chart still shows us at the same place as Friday’s chart did; only the degree labelling has changed.
And so, wave C{-8} within wave 4{-7}, an upward correction, continues its rise. Overnight it stalled in a brief sideways correction — wave 4{-9} — and I expect it to follow with a final upward movement, wave 5{-9}.
The first alternative — that wave 4{-7} is complete — will be invalidated by a further rise. The second alternative — that wave 4{-7} will form a compound structure of two corrective patterns — will remain a possibility until the price falls below the beginning of wave 4{-7}, which is 4212.75.
The end of wave 4{-7} will be followed by a resumption of the downtrend that began on January 4 from 4808.25. Wave 5{-7} will stretch below 4212.75, perhaps significantly so. It’s end will also mark the end of its parent wave 1{-6}, which also began on January 4.
The We Are Here list. As part of my weekend work, I’ve built a list of waves that shows where we are at present with the S&P 500, from the lowly wave C{-8} corrective component, which is now in its 5th day. all the way up wave 5{0} itself, which has been with us for more than three years.
Each line on the list shows the wave number, with the subscript in curly brackets, the traditional degree name, the starting date, the starting price of the S&P 500 E-mini futures, and the direction of the wave.
We Are Here
- 5{0} Intermediate, 12/21/2018, 2316.75 (up)
- 3{1} Minor, 3/23/2018 2174 (up)
- 5{-2} Minute, 10/4/2020, 4267.50 (up)
- 4{-3} Minuette, 1/4/2022, 4808.25 (down)
- A{-4} Subminuette, 1/4/2022, 4808.25 (down)
- 1{-5} Micro, 1/4/2022, 4808.25 (down)
- 1{-6} Submicro, 1/4/2022, 4808.25 (down)
- 4{-7} Minuscule, 1/24/2022, 4212.75 (up)
- C{-8} Subminuscule, 1/26/2022, 4263.75 (up)
Learning and other resources. Elliott wave analysis provides context, not prophecy. As the 20th century semanticist Alfred Korzybski put it this way in his book Science and Sanity (1933), “The map is not the territory … The only usefulness of a map depends on similarity of structure between the empirical world and the map.” And I would add, in the ever-changing markets, we can judge that similarity of structure only after the fact.
See the menu page Analytical Methods for a rundown on where to go for information on Elliott wave analysis.
By Tim Bovee, Portland, Oregon, January 31, 2022
Disclaimer
Tim Bovee, Private Trader tracks the analysis and trades of a private trader for his own accounts. Nothing in this blog constitutes a recommendation to buy or sell stocks, options or any other financial instrument. The only purpose of this blog is to provide education and entertainment.
No trader is ever 100 percent successful in his or her trades. Trading in the stock and option markets is risky and uncertain. Each trader must make trading decisions for his or her own account, and take responsibility for the consequences.
License
All content on Tim Bovee, Private Trader by Timothy K. Bovee is licensed under a Creative Commons Attribution-ShareAlike 4.0 International License.
Based on a work at www.timbovee.com.

You must be logged in to post a comment.