3:30 p.m. New York time
Half an hour before the closing bell. The S&P 500 futures came within 6 cents of the 61.8% retracement point and then pulled back slightly. If today’s high so far, 4580.75, is the peak of wave 5{-9} within C{-8}, then that’s in line with the rules of Elliott wave analysis, which allow the 5th wave to fall short of the end of the preceding 3rd wave, a condition known as truncation. On the other hand, falling short in this way could well mean that a compound correction is underway, a pattern described in the discussion of Alternative #1. I’m leaving my principal analysis unchanged at this point: Upward wave 5{-9} within wave C{-8} within wave 2{-7} is still underway. I’ve updated the chart.
10:15 a.m. New York time
DIS earnings play entry. I’ve entered a short bear call options spread on DIS and have posted an analysis of the trade.
I also analyzed KO as a potential earnings play, but the market was offering too small a premium by my standards. I prefer that the premium cover 33% of the width between the short and long legs of a vertical spread. KO came it at 30%.
9:35 a.m. New York time
What’s happening now? The S&P 500 E-mini futures rose in overnight trading, approaching the 61.8% retracement level and ending three days of sideways trading.
What does it mean? The correction from January 24 is in its third leg, and that leg is in its final upward push. In turn, that upward push began its third phase overnight, typically the most powerful of the three movements in the direction of the trend. The rise will remain below 4808.25 — the January 4 high — and when complete will mark the end of the correction and the resumption of the downtrend.
What are the alternatives? There are two:
Alternative #1: When the present rise is complete, the price might decline in a wave that links to a second corrective pattern, known as a compound correction, rather than resuming the downtrend. This alternative will be disproven if the price moves below the January 24 low, 4212.75.
Alternative #2: It’s still possible that the high of February 2 — 4586 — marked the end of the correction, the the subsequent decline was the first part of the resumed downtrend. This alternative will be disproven if the price moves above 4586. The closer the price moves toward that level, the less likely this alternative becomes.
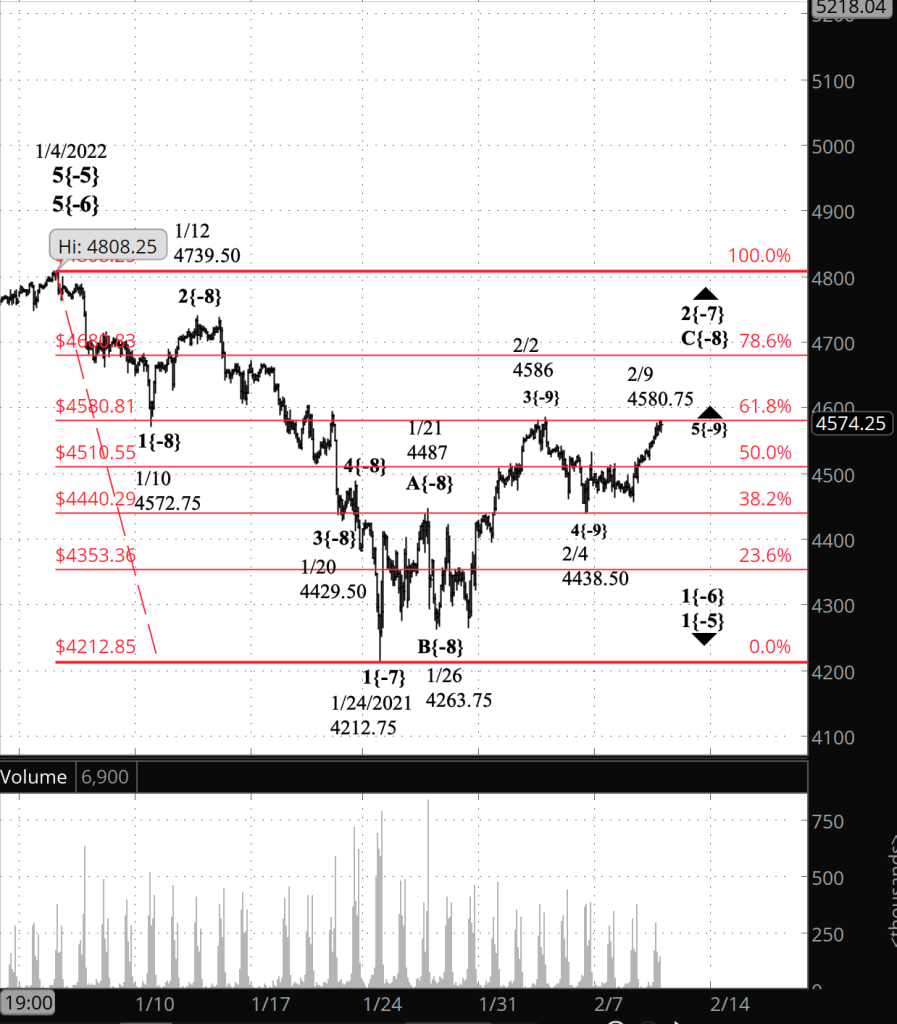
What does Elliott wave theory say? Within wave 2{-7} — the upward correction that began on January 24 — upward wave C{-8} is in its final portion, wave 5{-10}, out of five waves total. And wave 5{-10} in turn is in its middle leg, wave 3{-11}.
Wave 5{-10} will complete wave C{-9}, but under Alternative #1, it may not be the completion of the parent, wave 2{-7}. A decline will follow C{-9}, but its meaning will be ambiguous. Either the decline will be the first wave within wave 3{-7} — the next leg of the downtrend — or it will be wave X{-9}, setting up a second corrective pattern. within an ongoing wave 2{-7}.
Under Alternative #2, the high of February 2 marked the end of wave 5{-9}, the February 4 low was the end of the first wave within wave 3{-7}, the the subsequent rise was a 2nd wave correction within wave 3{-7}.
We Are Here.
These are the waves currently in progress under my principal analysis. Each line on the list shows the wave number, with the subscript in curly brackets, the traditional degree name, the starting date, the starting price of the S&P 500 E-mini futures, and the direction of the wave.
- 5{0} Intermediate, 12/21/2018, 2316.75 (up)
- 3{1} Minor, 3/23/2018 2174 (up)
- 5{-2} Minute, 10/4/2020, 4267.50 (up)
- 4{-3} Minuette, 1/4/2022, 4808.25 (down)
- A{-4} Subminuette, 1/4/2022, 4808.25 (down)
- 1{-5} Micro, 1/4/2022, 4808.25 (down)
- 1{-6} Submicro, 1/4/2022, 4808.25 (down)
- 2{-7} Minuscule, 1/24/2022, 4212.75 (up)
- C{-8} Subminuscule, 1/26/2022, 4263.75 (up)
Learning and other resources. Elliott wave analysis provides context, not prophecy. As the 20th century semanticist Alfred Korzybski put it this way in his book Science and Sanity (1933), “The map is not the territory … The only usefulness of a map depends on similarity of structure between the empirical world and the map.” And I would add, in the ever-changing markets, we can judge that similarity of structure only after the fact.
See the menu page Analytical Methods for a rundown on where to go for information on Elliott wave analysis.
By Tim Bovee, Portland, Oregon, February 9, 2022
Disclaimer
Tim Bovee, Private Trader tracks the analysis and trades of a private trader for his own accounts. Nothing in this blog constitutes a recommendation to buy or sell stocks, options or any other financial instrument. The only purpose of this blog is to provide education and entertainment.
No trader is ever 100 percent successful in his or her trades. Trading in the stock and option markets is risky and uncertain. Each trader must make trading decisions for his or her own account, and take responsibility for the consequences.
License
All content on Tim Bovee, Private Trader by Timothy K. Bovee is licensed under a Creative Commons Attribution-ShareAlike 4.0 International License.
Based on a work at www.timbovee.com.

[…] rather than having ended on February 4. There are other alternatives looking further out (see yesterday’s Trader’s Notebook), but for now, this is the one that […]
LikeLike