3:45 p.m. New York time
And there’s more. The S&P 500 futures prices continued to decline, meaning that wave C{-11} within wave 4{-10} still has some downside to go before wave 5{-10} begins. The low as of this update is 4485.50.
3:30 p.m. New York time
Half an hour before the closing bell. The S&P 500 traced a roller coaster ride today, dropping in less than an hour from the overnight peak of 4583.25 to 4512.50, and then reversing back up to 4581.75 in the first hour of trading session. During the session it worked its way still lower, to 4498.75, before reversing and rising again. As the closing bell approaches, the price is sticking close to the 50% retracement level after a journey that began from slightly above the 61.8% retracement level.
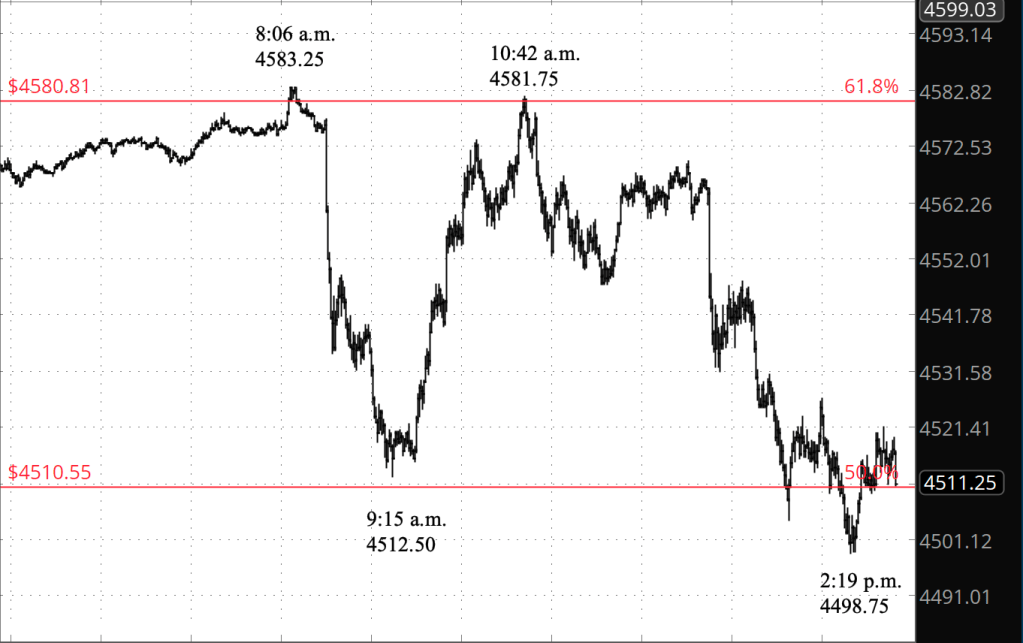
What to make of all of that? First, the February 9 high, 4585, was challenged but not surpassed, therefore this morning’s principal analysis stands: Wave 5{-9} within wave C{-8} within wave 2{-7} remains underway. Today’s drama was within wave 5{-9}.
I count it this way: The decline and rise is wave 4{-10}, a downward correction within uptrending wave 5{-9}. The first decline in overnight trading was wave A{-11} within wave 4{-10}, the subsequent rise is wave B{-11}, and the decline that followed is wave C{-11}, ending wave 4{-10}, unless the correction develops into a compound structure. In that latter case, there will be a rising X-wave and then a second corrective pattern.
So in the chart above, clearly, we’re seeing an A wave with three internal waves, a B wave with three waves within it, and a C wave with five waves internally. The 3-3-5 pattern means it’s a Flat, one of the standard corrective patterns identified by Elliott wave theory.
The rise this afternoon is the beginning of wave 5{-10} within wave 5{-9}. I expect it to rise above the February 9 high, 4585, which is the end of wave 3{-10}. If the price does rise above that level, then the wave 5{-10} analysis is proven. If the price stays below that level, then the compound correction analysis is more likely.
I’ve updated the chart below.
9:35 a.m. New York time
What’s happening now? The S&P 500 E-mini futures traded around the 61.8% retracement level overnight until an hour before the opening bell, when it dropped rapidly to the 50% retracement level. The drop covered 65 points in 44 minutes.
What does it mean? The timing of the sudden decline coincided with the release of inflation numbers in the United States. (The inflation report can be read here.)
By my principal analysis, yesterday’s high marked the end, at 4585, of the middle leg of a five-leg rise that began on February 4. The decline this morning is part of the ensuing correction, and the price will soon rise above yesterday’s high in the final leg of the rise from February 4. That final leg will complete the larger upward correction that began on January 24 from 4212.75 and will be followed by a decline below that level, perhaps significantly so.
What’s the alternative? Since the price yesterday remained below the February 2 high, 4586, the downward correction from February 2 within the upward correction that began January 24 can be seen as still underway rather than having ended on February 4. There are other alternatives looking further out (see yesterday’s Trader’s Notebook), but for now, this is the one that counts.
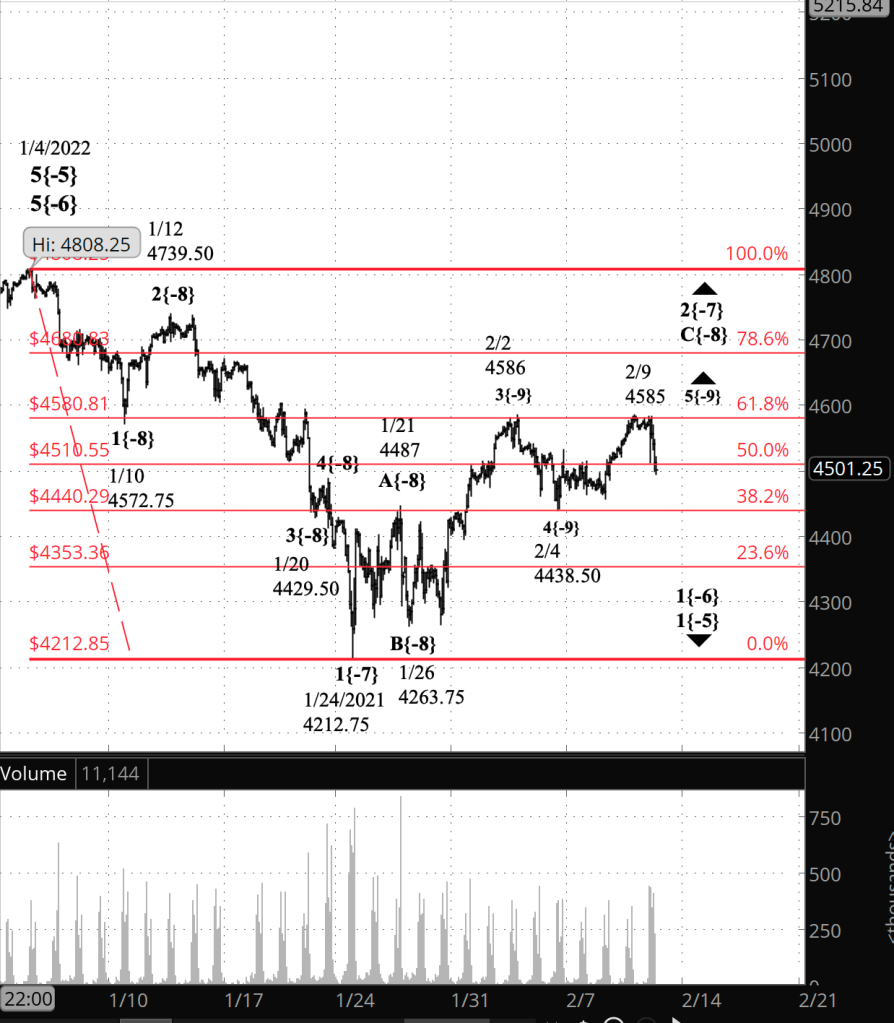
What does Elliott wave theory say? Under my principal analysis, this morning’s decline is wave 4{-10} within uptrending wave 5{-9} within uptrending wave C{-8} within the upward correction 4{-8},. which began on January 24.
Under my alternative analysis, this morning’s decline is the beginning of wave C{-10} within downward correction wave 4{-9} within uptrending wave C{-8} within the upward correction 4{-8},. which began on January 24.
We Are Here.
These are the waves currently in progress under my principal analysis. Each line on the list shows the wave number, with the subscript in curly brackets, the traditional degree name, the starting date, the starting price of the S&P 500 E-mini futures, and the direction of the wave.
- 5{0} Intermediate, 12/21/2018, 2316.75 (up)
- 3{1} Minor, 3/23/2018 2174 (up)
- 5{-2} Minute, 10/4/2020, 4267.50 (up)
- 4{-3} Minuette, 1/4/2022, 4808.25 (down)
- A{-4} Subminuette, 1/4/2022, 4808.25 (down)
- 1{-5} Micro, 1/4/2022, 4808.25 (down)
- 1{-6} Submicro, 1/4/2022, 4808.25 (down)
- 2{-7} Minuscule, 1/24/2022, 4212.75 (up)
- C{-8} Subminuscule, 1/26/2022, 4263.75 (up)
Learning and other resources. Elliott wave analysis provides context, not prophecy. As the 20th century semanticist Alfred Korzybski put it this way in his book Science and Sanity (1933), “The map is not the territory … The only usefulness of a map depends on similarity of structure between the empirical world and the map.” And I would add, in the ever-changing markets, we can judge that similarity of structure only after the fact.
See the menu page Analytical Methods for a rundown on where to go for information on Elliott wave analysis.
By Tim Bovee, Portland, Oregon, February 10, 2022
Disclaimer
Tim Bovee, Private Trader tracks the analysis and trades of a private trader for his own accounts. Nothing in this blog constitutes a recommendation to buy or sell stocks, options or any other financial instrument. The only purpose of this blog is to provide education and entertainment.
No trader is ever 100 percent successful in his or her trades. Trading in the stock and option markets is risky and uncertain. Each trader must make trading decisions for his or her own account, and take responsibility for the consequences.
License
All content on Tim Bovee, Private Trader by Timothy K. Bovee is licensed under a Creative Commons Attribution-ShareAlike 4.0 International License.
Based on a work at www.timbovee.com.

You must be logged in to post a comment.