3:30 p.m. New York time
Half an hour before the closing bell. The S&P 500 declined during the session, reaching a low of 4398.25 so far on the futures. The decline put the price below the 38.2% retracement level. There’s nothing in today’s patterns that requires a change in this morning’s analysis, and so it stands. I’ve updated the chart.
2:10 p.m. New York time
MS earnings play, partial exit. MS soared beyond the boundaries of my iron condor after earnings were published, and with seven days left before expiration, I’ve exited the in-the-money calls for a loss to avoid the possibility of assignment. I’ve updated the entry analysis with details of the exit.
9:35 a.m. New York time
What’s happening now? The S&P 500 E-mini futures approached the 38.2% Fibonacci retracement level in overnight trading and then rose to the 50% retracement.
What does it mean? I’ve revised my labeling in light of yesterday’s market movements. The downward correction that began on February 2 is still underway and is in its third and most likely final phase. When the correction is complete, then the price will resume its rise, part of a larger upward correction that began on January 24. The large decline on February 10 was the middle leg of the final phase of the correction. I expect a rise and then a final decline to wrap up the correction.
What are the alternatives? There are two alternatives
Alternative #1: The correction could extend into a compound structure, stringing together two or three corrective patterns.
Alternative #2: The middle leg of the final phase could be the final leg of the final phase. If that’s the case, then the rise overnight is the beginning of the last leg of the larger correction that began on January 24.
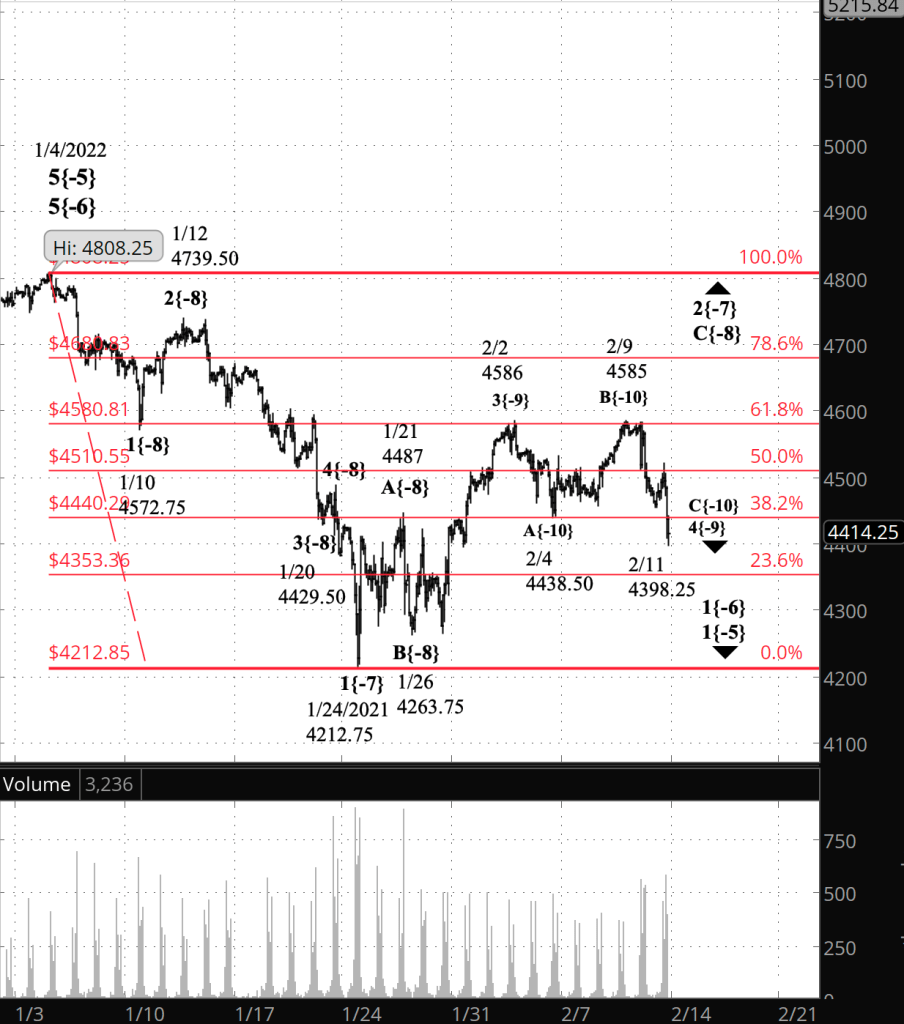
What does Elliott wave theory say? My prior analysis had labeled the February 4 low as the end of wave 4{-9}. The magnitude of the movements on February 10 makes a new labeling more in line with the requirement in Elliott that waves have the “right look”. I interpret that to mean that there can’t be a wild divergence in size among waves of the same degree. Yesterday’s outsized movements placed my former labeling beyond “right look”.
So the new labels have the February 4 low as the end of of wave A{-10} within 4{-9}, the February 9 high as the end of wave B{-10}. And then it gets tricky. The low of February 10 would on the chart be a “right look” end point for wave C{-10}. However, the wave 4{-9} correction is taking the form of a Zigzag (with a 5-3-5 internal wave structure). I count only three waves so far within wave C{-10}. So a rise and then a decline will me need to complete C{-10}.
Under my principal analysis, the end of wave C{-10} will also mark the end of its parent wave 4{-9}. However, my Alternative #1 recognizes that it’s possible that the wave 4{-9} correction will take a compound form, with the present first corrective pattern being followed by wave X{-10} to the upside, which will be followed by a second corrective pattern. Compound corrections can contain up to three corrective patterns.
In either case, the correction will be followed by wave 5{-10}, a rise that most likely will move above the February 2 high, 4586, which ended the preceding wave 3{-9}. Fifth waves are sometimes truncated, so there’s no guarantee that wave 5{-9} will reach above that level.
Alternative #2 considers the low of February 10 to be the end of wave 4{-9}, and the subsequent upward movement to be the first tentative step in uptrending wave 5{-9}. In a Flat or Zigzag pattern, wave C{-10} must have five waves internally. I count only three so far, and so I consider this alternative to be less likely. However, there is ambiguity in all waves, and so it could be that wave 5{-9} is now underway.
We Are Here.
These are the waves currently in progress under my principal analysis. Each line on the list shows the wave number, with the subscript in curly brackets, the traditional degree name, the starting date, the starting price of the S&P 500 E-mini futures, and the direction of the wave.
- 5{0} Intermediate, 12/21/2018, 2316.75 (up)
- 3{1} Minor, 3/23/2018 2174 (up)
- 5{-2} Minute, 10/4/2020, 4267.50 (up)
- 4{-3} Minuette, 1/4/2022, 4808.25 (down)
- A{-4} Subminuette, 1/4/2022, 4808.25 (down)
- 1{-5} Micro, 1/4/2022, 4808.25 (down)
- 1{-6} Submicro, 1/4/2022, 4808.25 (down)
- 2{-7} Minuscule, 1/24/2022, 4212.75 (up)
- C{-8} Subminuscule, 1/26/2022, 4263.75 (up)
Learning and other resources. Elliott wave analysis provides context, not prophecy. As the 20th century semanticist Alfred Korzybski put it this way in his book Science and Sanity (1933), “The map is not the territory … The only usefulness of a map depends on similarity of structure between the empirical world and the map.” And I would add, in the ever-changing markets, we can judge that similarity of structure only after the fact.
See the menu page Analytical Methods for a rundown on where to go for information on Elliott wave analysis.
By Tim Bovee, Portland, Oregon, February 11, 2022
Disclaimer
Tim Bovee, Private Trader tracks the analysis and trades of a private trader for his own accounts. Nothing in this blog constitutes a recommendation to buy or sell stocks, options or any other financial instrument. The only purpose of this blog is to provide education and entertainment.
No trader is ever 100 percent successful in his or her trades. Trading in the stock and option markets is risky and uncertain. Each trader must make trading decisions for his or her own account, and take responsibility for the consequences.
License
All content on Tim Bovee, Private Trader by Timothy K. Bovee is licensed under a Creative Commons Attribution-ShareAlike 4.0 International License.
Based on a work at www.timbovee.com.

You must be logged in to post a comment.