3:30 p.m. New York time
Half an hour before the closing bell. The S&P 500 futures rose toward the 38.2% retracement level and then fell back to the 23.6% level, remaining slightly above the overnight low, 4354. My analysis from the morning is unchanged, and the same goes for the caveat in the alternative analysis. Bottom line: Wave C{-10} within wave 4{-9} — a downward move within an upward correction — is underway, and may have ended at 4354, although that’s not a certainty. When it ends, then wave 5{-9} will begin. The price will rise but will remain below 4808.25, the high of January 4. I’ve updated the chart.
2:30 p.m. New York time
SPY short bear call spread exit. I’ve exited my short bear call options spread spread for an 85% profit and have updated the entry analysis with full details of the exit.
9:35 a.m. New York time
What’s happening now? The S&P 500 E-mini futures fell to 4354 after trading resumed overnight and then reversed, rising slightly. The reversal came at the 23.6% Fibonacci retracement level.
What does it mean? The downward correction continues. It began on February 2 from 4586. The downward correction is a component within an upward correction that began January 24 from 4212.75. Each correction is in its final leg final, and the end of the smaller correction will trigger a final rise that will bring the larger correction to an end.
There is much more to unravel in this complex moment for the markets. See the Elliott wave theory section below for discussion.
What’s the alternative? The primary question is when will the smaller correction end. It may have ended overnight at the 4354 level. But that’s not a certainty.
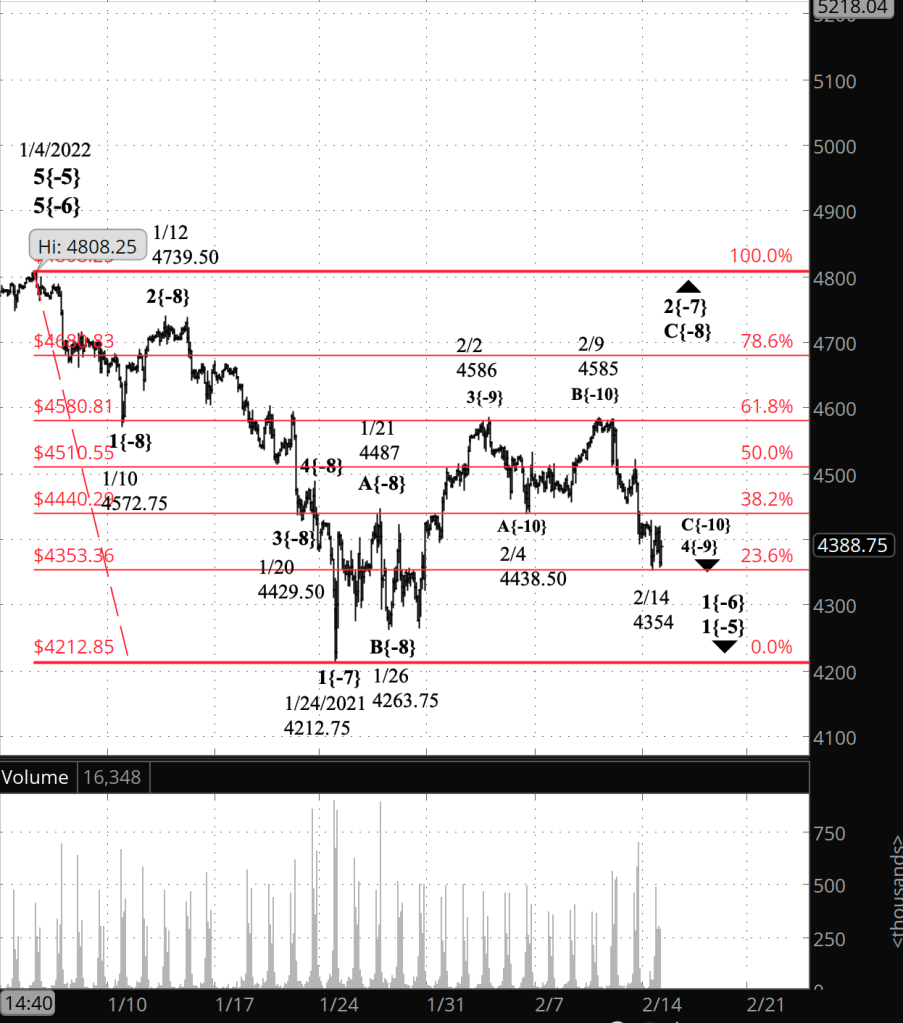
What does Elliott wave theory say? The smaller, downward correction is wave 4{-9} and internally, it is internally in wave C{-10}. The end of the wave C{-10} will also mark the end of wave 4{-9}, triggering an upward movement, wave 5{-9}, which will remain below the January 4 peak, 2808.25.
The larger correction is wave 2{-7}, which began January 24 from 4212.75, and internally, it is within its final leg, wave C{-8}, whose end will mark a resumption of the downtrend that began on January 4, wave 3{-7}, a powerful wave that almost certainly will carry the price below 4212.75, the end of the preceding 1st wave.
Wave 3{-7} is the middle leg of a 1st wave at the {-6} degree, which in turn is the 1st wave within its parent degree, {-5}, which in turn is part of a downward correction, wave A{-4} within wave 4{-3}, all of which began on January 4.
And so, on to the alternative. Everything hinges on whether wave C{-10} is over or not. It’s a downward movement and will have five subwaves. As I count it, it is now in its 5th wave, which is the shortest of the three downward waves. If the price reverses and that 5th wave continues downward, then it comes down to its length relative to that the preceding 3rd wave. The 3rd wave can’t be the shortest wave in the direction of the trend, and if the 5th wave turns out to be longer than the 3rd, then count will need to be redone
We Are Here.
These are the waves currently in progress under my principal analysis. Each line on the list shows the wave number, with the subscript in curly brackets, the traditional degree name, the starting date, the starting price of the S&P 500 E-mini futures, and the direction of the wave.
- 5{0} Intermediate, 12/21/2018, 2316.75 (up)
- 3{1} Minor, 3/23/2018 2174 (up)
- 5{-2} Minute, 10/4/2020, 4267.50 (up)
- 4{-3} Minuette, 1/4/2022, 4808.25 (down)
- A{-4} Subminuette, 1/4/2022, 4808.25 (down)
- 1{-5} Micro, 1/4/2022, 4808.25 (down)
- 1{-6} Submicro, 1/4/2022, 4808.25 (down)
- 2{-7} Minuscule, 1/24/2022, 4212.75 (up)
- C{-8} Subminuscule, 1/26/2022, 4263.75 (up)
- 4{-9} Bitsy, 2/2/2022, 4586 (down)
- C{-10}Subbitsy, 2/9/2022, 4585 (down)
Learning and other resources. Elliott wave analysis provides context, not prophecy. As the 20th century semanticist Alfred Korzybski put it this way in his book Science and Sanity (1933), “The map is not the territory … The only usefulness of a map depends on similarity of structure between the empirical world and the map.” And I would add, in the ever-changing markets, we can judge that similarity of structure only after the fact.
See the menu page Analytical Methods for a rundown on where to go for information on Elliott wave analysis.
By Tim Bovee, Portland, Oregon, February 14, 2022
Disclaimer
Tim Bovee, Private Trader tracks the analysis and trades of a private trader for his own accounts. Nothing in this blog constitutes a recommendation to buy or sell stocks, options or any other financial instrument. The only purpose of this blog is to provide education and entertainment.
No trader is ever 100 percent successful in his or her trades. Trading in the stock and option markets is risky and uncertain. Each trader must make trading decisions for his or her own account, and take responsibility for the consequences.
License
All content on Tim Bovee, Private Trader by Timothy K. Bovee is licensed under a Creative Commons Attribution-ShareAlike 4.0 International License.
Based on a work at www.timbovee.com.

[…] For a broader view, see the chart in yesterday’s Trader’s Diary. […]
LikeLike