7:15 p.m. New York time
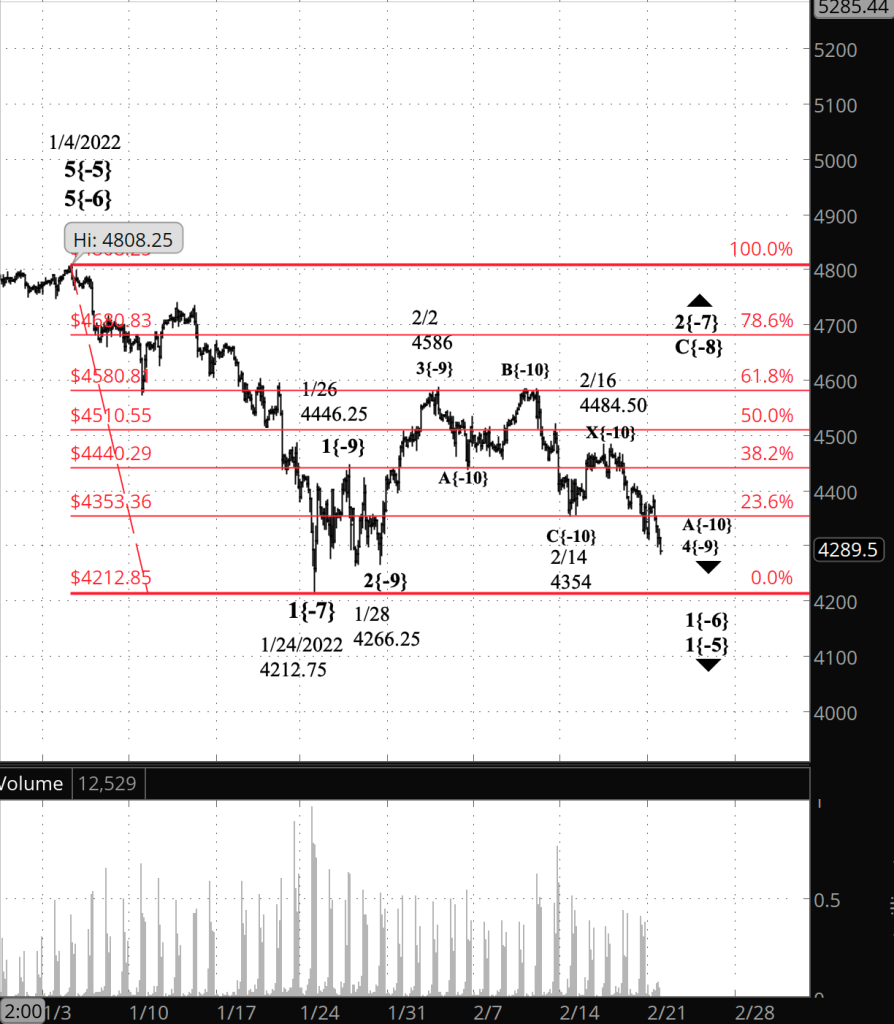
Next-day open. As the S&P 500 futures re-opened, at 5 p.m., for the overnight session leading to Tuesday’s market open, the price declined below the 4266.25 level — the end point 1{-7} — triggering a reanalysis of the chart, which I have completed with a glass of fine wine in hand while watching “The Guilded Age” (Season 1 Episode 2) on HBO Now. The price has so far dropped to 4250. The decline that began on January 4 has resumed. In Elliott wave terms, wave 2{-7} to the upside ended on February 7, wave 3{-7} to the downside is still underway, all within wave 1{-6} to the downside.
I’ve retained the old analysis in the chart from this morning, and here is the new chart.
3 p.m. New York time
At the close. The S&P 500 futures moved slightly lower during the shortened trading session but remained above the price level, 4266.25, that would trigger a re-analysis of the chart. No change in the present prime analysis. I’ve updated the chart.
9:45 a.m. New York time
ACI earnings play expires. The call options in my earnings play on ACI expired on Saturday. In January I exited the put options which were in the money, in order to avoid exercise. The remaining call options remained out of the money and expired without value, providing maximum profit. I’ve updated the ACI analysis with results from the calls exit and with an analysis of the original iron condor position, puts and calls.
9:35 a.m. New York time
Holiday. Most U.S. markets will be closed today in observance of the President’s Day holiday. Futures traded overnight and will continue trading until 1 p.m. New York time.
What’s happening now? The S&P 500 E-mini futures initially rose by 50 points in overnight trading but then declined back into the 4310s.
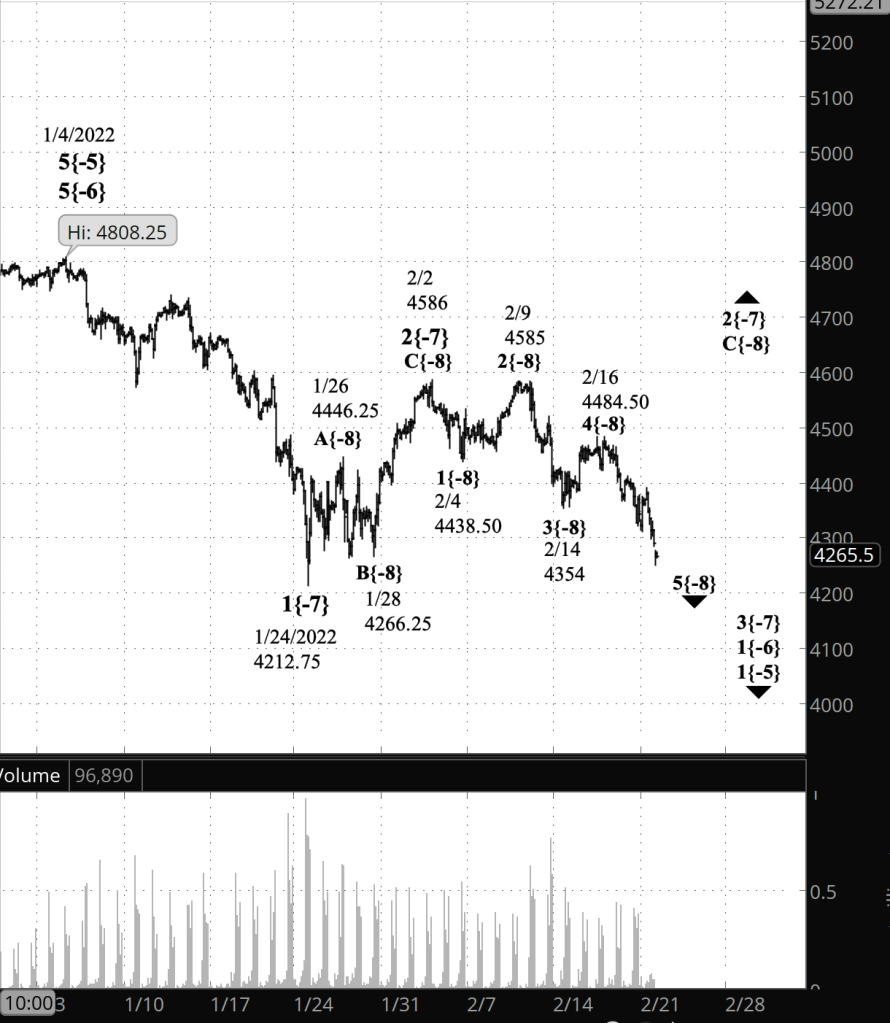
What does it mean? The downward correction that began on February 2 continues. Having completed one one corrective pattern, it has entered the first leg of a second pattern within a compound correction.
What’s the alternative? It’s possible that the February 2 high marked the end of an upward correction, and that the decline since then has been a resumption of the downtrend that began at the January 4 peak. A decline below 4266.25– the January 28 low — would confirm the alternative count.
What does Elliott wave theory say? Under the principal analysis, the first corrective pattern with wave 4{-9} — a downward correction — ended on February 14, the connecting wave X{-10} ended on February 16, and the ensuing decline is wave A{-10}, the first wave of a second corrective pattern within a compound correction. A of Elliott wave analysis forbids a count that shows a 4th wave moving beyond the end of the preceding wave 1 of the same degree. A move below 4266.25 would violate that rule and force a re-analysis of the chart.
The most likely alternative, if the present principal analysis is invalidated, would be an analysis that labels the February 2 high as the end of wave 2{-7}, an upward correction, and the subsequent decline as wave 3{-7}, a resumption of the downtrend that began on January 4.
We Are Here.
These are the waves currently in progress under my principal analysis. Each line on the list shows the wave number, with the subscript in curly brackets, the traditional degree name, the starting date, the starting price of the S&P 500 E-mini futures, and the direction of the wave.
- 5{0} Intermediate, 12/21/2018, 2316.75 (up)
- 3{1} Minor, 3/23/2018 2174 (up)
- 5{-2} Minute, 10/4/2020, 4267.50 (up)
- 4{-3} Minuette, 1/4/2022, 4808.25 (down)
- A{-4} Subminuette, 1/4/2022, 4808.25 (down)
- 1{-5} Micro, 1/4/2022, 4808.25 (down)
- 1{-6} Submicro, 1/4/2022, 4808.25 (down)
- 3{-7} Minuscule, 2/2/2022, 4586 (down)
- 5{-8} Subminuscule, 2/16/2022, 4484.50 (down)
Learning and other resources. Elliott wave analysis provides context, not prophecy. As the 20th century semanticist Alfred Korzybski put it this way in his book Science and Sanity (1933), “The map is not the territory … The only usefulness of a map depends on similarity of structure between the empirical world and the map.” And I would add, in the ever-changing markets, we can judge that similarity of structure only after the fact.
See the menu page Analytical Methods for a rundown on where to go for information on Elliott wave analysis.
By Tim Bovee, Portland, Oregon, February 21, 2022
Disclaimer
Tim Bovee, Private Trader tracks the analysis and trades of a private trader for his own accounts. Nothing in this blog constitutes a recommendation to buy or sell stocks, options or any other financial instrument. The only purpose of this blog is to provide education and entertainment.
No trader is ever 100 percent successful in his or her trades. Trading in the stock and option markets is risky and uncertain. Each trader must make trading decisions for his or her own account, and take responsibility for the consequences.
License
All content on Tim Bovee, Private Trader by Timothy K. Bovee is licensed under a Creative Commons Attribution-ShareAlike 4.0 International License.
Based on a work at www.timbovee.com.

[…] evening after a morning session and a break. Monday’s Trader’s Notebook can be found here. It contains charts of both the old analysis and the new one, for comparison. Another item in the […]
LikeLike