3:30 p.m. New York time
Half an hour before the closing bell. The S&P 500 futures rose by nearly 109 points during the session and then declined, coming to within a point and a half of the overnight low.
The downtrend continues, presently as wave 5{-9} within wave 3{-8}. The end of wave 5{-9} will also be the end of 3{-8}, which will be followed by a, most likely, sideways correction, wave 4{-8}, and then by a final push to the downside, wave 5{-8}.
Looking to the future, that final push at its completion will mark the end of its parent wave, 1{-7}, which began at the January 4 peak. The ensuing upward correction, wave 2{-7}, will most likely retrace much of the decline since early January. The only limit on its upward movement is the start of the preceding wave 1{-7}, at 4808.25. There’s no guarantee, of course, that the price will approach that neighborhood.
I’ve updated the chart.
1:30 p.m. New York time
SPY bear play. I’ve entered a short bear call vertical spread on SPY, based on my analysis of the S&P 500 E-mini futures showing that the downtrend that began January 4 has resumed after an upward correction. I’ve posted an analysis of the trade.
9:35 a.m. New York time
The holiday Trader’s Notebook. The stock markets may take holidays but the futures rarely do. The S&P 500 E-mini futures traded on Monday — a market holiday in the U.S. — and I posted an analysis. It proved to be an eventful day when trading resumed in the evening after a morning session and a break. Monday’s Trader’s Notebook can be found here. It contains charts of both the old analysis and the new one, for comparison. Another item in the Monday post points to the exit analysis of my options position in ACI, which can be read here.
What’s happening now? The S&P 500 E-mini futures fell below a key price level, 4266.25, early in overnight trading and around 3 a.m., the time that the London stock exchange opened, reversed, rising by more than 95 points.
What does it mean? The piercing of the 4266.25 level confirms a resumption of the downtrend that began on January 4 from 4808.25. The correction from January 24 ended and the middle leg of the downtrend began on February 2, from 4586. Internally, the first segment of that middle leg is nearing its end and will be followed by an upward correction of fairly small size. The overnight bounce may have been the beginning of the correction, although it could be smaller reversal within that first segment.
What’s the alternative? The ambiguities resolve around the size — the degree — of the decline so far, which in turn is important in understanding how great a decline is possible at this point. More on the subject in the Elliott wave theory section.
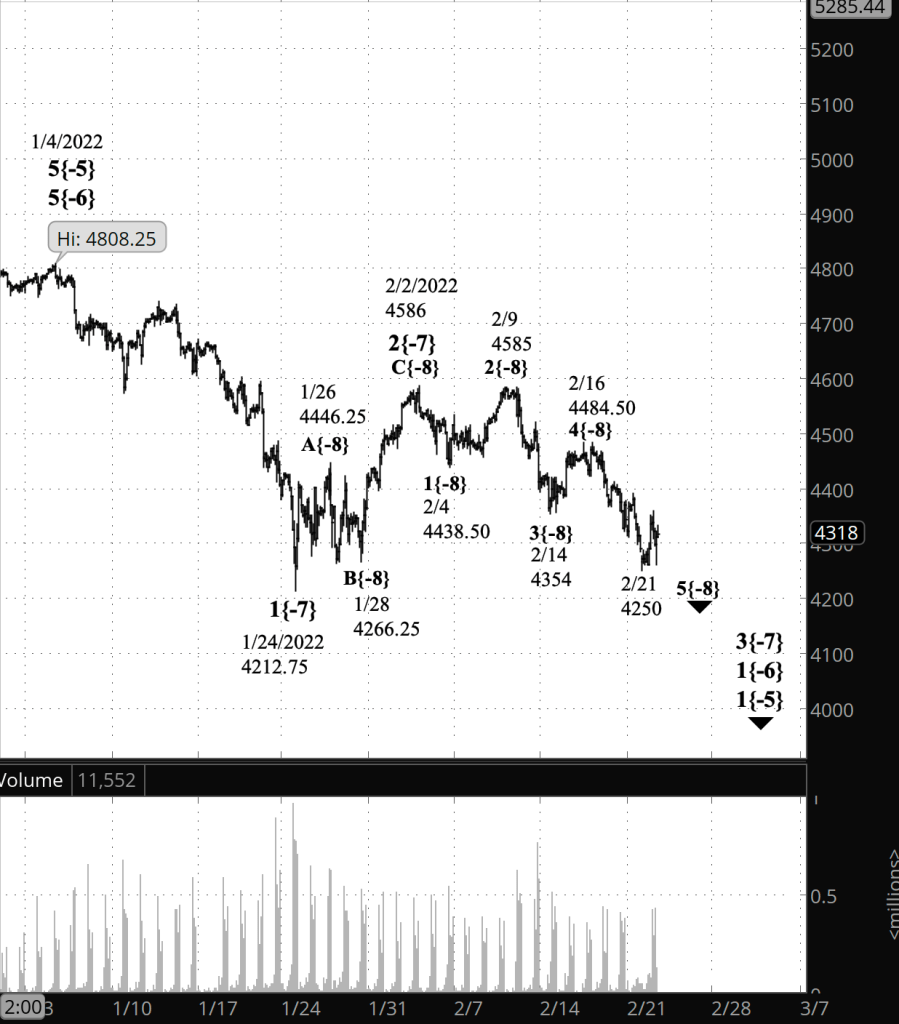
What does Elliott wave theory say? By my principal analysis, the futures are presently in wave 5{-8}, which began on February 16, within wave 3{-7}, beginning February 2, within wave 1{-6}, which began with the January 4 peak. Within wave 5{-8}, it would appear that it is in its final wave, 5{-9}, although it’s not an entirely clear count. The morning bounce could be a correction within wave 5{-9}, or it could be the beginning of a wave 4{-7} correction to the upside.
Prior to Monday evening, my principal analysis had wave 4{-9} underway, a downward compound correction that began on February 2. Under the Elliott rules, 4th waves can’t move beyond the end of the preceding 1st wave, which was at 4266.25. When the price moved below that level Monday evening, I re-analyzed the chart to bring it back into conformance withe the rules of Elliott wave analysis. The only way to do that was to count the correction — wave 2{-7} — as having ended on February 2, and the downtrend to have resumed, as wave 3{-7}, on that date.
In the revised analysis, I’ve counted the waves after February 2 as being of the {-8} degree. There’s no reason why they couldn’t be of the {-9} degree, or even the {-10} degree. Selecting a degree in a new movement is at best a guess. I chose {-8} because the durations seemed to fit in with previous {-8} movements. But an alternative labeling at the {-9} degree or lower is entirely possible.
We Are Here.
These are the waves currently in progress under my principal analysis. Each line on the list shows the wave number, with the subscript in curly brackets, the traditional degree name, the starting date, the starting price of the S&P 500 E-mini futures, and the direction of the wave.
- 5{0} Intermediate, 12/21/2018, 2316.75 (up)
- 3{1} Minor, 3/23/2018 2174 (up)
- 5{-2} Minute, 10/4/2020, 4267.50 (up)
- 4{-3} Minuette, 1/4/2022, 4808.25 (down)
- A{-4} Subminuette, 1/4/2022, 4808.25 (down)
- 1{-5} Micro, 1/4/2022, 4808.25 (down)
- 1{-6} Submicro, 1/4/2022, 4808.25 (down)
- 3{-7} Minuscule, 2/2/2022, 4586 (down)
- 5{-8} Subminuscule, 2/16/2022, 4484.50 (down)
Learning and other resources. Elliott wave analysis provides context, not prophecy. As the 20th century semanticist Alfred Korzybski put it this way in his book Science and Sanity (1933), “The map is not the territory … The only usefulness of a map depends on similarity of structure between the empirical world and the map.” And I would add, in the ever-changing markets, we can judge that similarity of structure only after the fact.
See the menu page Analytical Methods for a rundown on where to go for information on Elliott wave analysis.
By Tim Bovee, Portland, Oregon, February 22, 2022
Disclaimer
Tim Bovee, Private Trader tracks the analysis and trades of a private trader for his own accounts. Nothing in this blog constitutes a recommendation to buy or sell stocks, options or any other financial instrument. The only purpose of this blog is to provide education and entertainment.
No trader is ever 100 percent successful in his or her trades. Trading in the stock and option markets is risky and uncertain. Each trader must make trading decisions for his or her own account, and take responsibility for the consequences.
License
All content on Tim Bovee, Private Trader by Timothy K. Bovee is licensed under a Creative Commons Attribution-ShareAlike 4.0 International License.
Based on a work at www.timbovee.com.

You must be logged in to post a comment.