3:30 p.m. New york time
Half an hour before the closing bell. The S&P 500 futures rose during the day, pushing above the 50% retracement level. The rise puts the price within the target range for the present correction — between the 50% and the 78.6% retracement levels (4354 to 4494.50).
That target level is for the entire correction, wave 4{-7}. By this morning’s count, the entire rise has been wave A{-8}, the first leg of the parent 4th wave. The rise so far can be seen either a wave A{-8} with five subwaves, or as the entirely of wave 4{-7}, with three subwaves, one of which is a very small B wave.
The wave-A-only scenario means that correction is taking the form of a Zigzag, the same form as the previous 2nd wave correction. Normally waves 2 and 4 have different patterns, but not always. So it’s a tendency, not a rule.
The full-wave-4 scenario has a B-wave that is only 62.5 points long. Elliott wave analysis focuses on the length of wave B in relation to wave A. The A wave in this scenario is 188.25 points long. So wave B has retraced 33.2% of wave A. In Zigzags, B waves typically retrace 38% to 79% of the preceding A waves, so this B wave is coming up a bit short. In Flats, the B wave retraces 100% to 138% of wave A, and this wave B is coming in way too short.
So although those lengths are guidelines and not rules, I think it far more reasonable to treat the rise so far as wave A{-8}, with five internal waves, meaning that we’re tracing out a Zigzag correction to the upside and waves B and C lie in the future.
Bottom line: No change in the analysis. I’ve updated the chart.
11 a.m. New York time
LVS earnings play exit. I’ve exited my short bull put vertical options spread for 9.2% of maximum potential profit and have updated the trade analysis with full results.
9:37 a.m. New York time
What’s happening now? The S&P 500 E-mini futures overnight pushed above the 38.2% Fibonacci retracement level, paused (as in common at Fibonacci levels), and then rose past it.
What does it mean? The upward correction that began on February 24 continues and is in its first of three legs, the first one rising, the second one falling, and the third leg rising. The first upward leg has met the minimum requirements identified by Elliott wave analysis if the correction is a Flat pattern (three waves within the first wave), which is the most likely scenario. The second leg, also with three legs internally, could begin at any time. The entire correction, if it is typical, will end between the 50% and 78.6% retracement levels (4354 and 4494.50).
What’s the alternative? If the correction is forming a Zigzag, then the first internal wave will have five waves internally. The target range wouldn’t apply to a Zigzag. See more in the Elliott wave theory secvtion below.
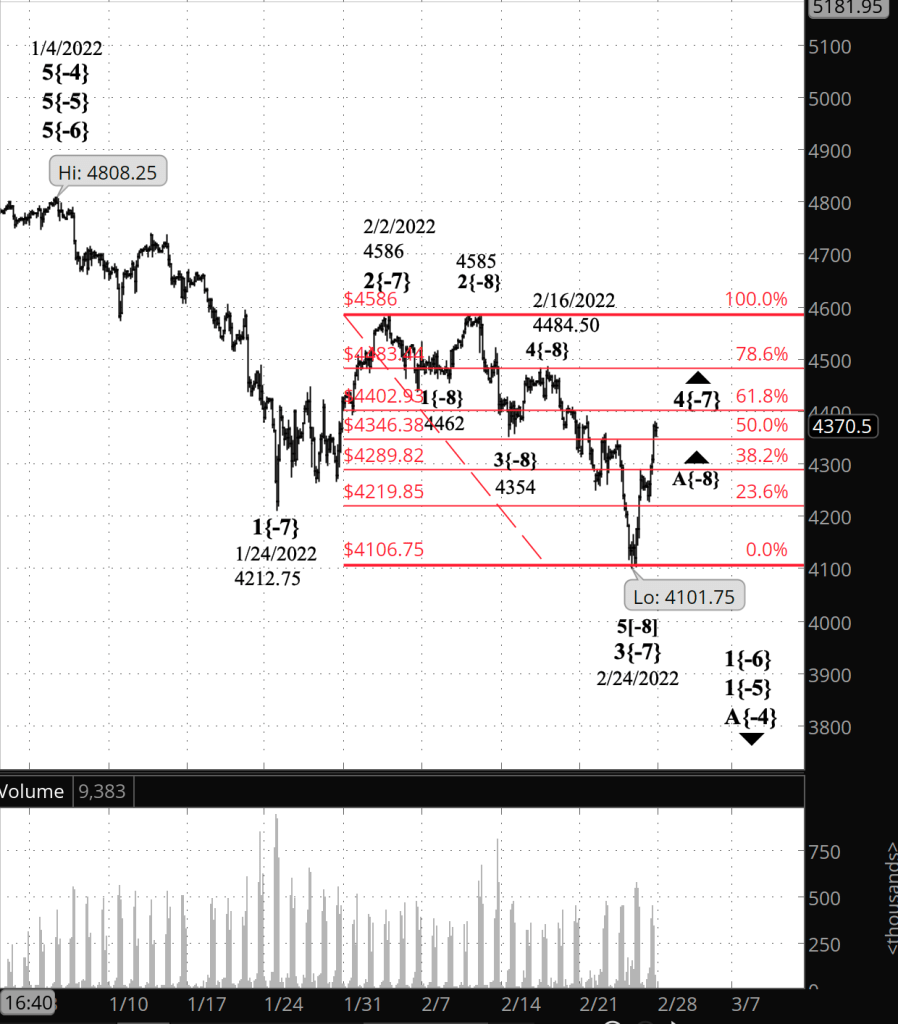
What does Elliott wave theory say? The rise of February 24 is wave 4{-7} and within it, wave A{-8} is under way. Both the Flat and the Zigzag pattern have three subwaves — A, B, C — but differ in the number of waves within the subwaves.. For a Flat, the internal counts are 3-3-5, and for a Zigzag, 5-3-5. Wave 2{-7} was a Zigzag, and since 2nd and 4th waves tend to have different patterns, wave 4{-7} is likely to be a Flat. Wave A{-8} already has formed three waves internally, and so if the structure is a Flat, wave B{-8} can begin at any time.
Fourth waves have a tendency to end within the range of the 4th wave within the preceding 3rd wave — that is, between the start and end points in this case of wave 4{-9} in wave 3{-7}. That range is 4354 and 4494.50, coinciding with the 50% and 78.6% retracement levels.
We Are Here.
These are the waves currently in progress under my principal analysis. Each line on the list shows the wave number, with the subscript in curly brackets, the traditional degree name, the starting date, the starting price of the S&P 500 E-mini futures, and the direction of the wave.
- 5{0} Intermediate, 12/21/2018, 2316.75 (up)
- 3{1} Minor, 3/23/2018 2174 (up)
- 5{-2} Minute, 10/4/2020, 4267.50 (up)
- 4{-3} Minuette, 1/4/2022, 4808.25 (down)
- A{-4} Subminuette, 1/4/2022, 4808.25 (down)
- 1{-5} Micro, 1/4/2022, 4808.25 (down)
- 1{-6} Submicro, 1/4/2022, 4808.25 (down)
- 4{-7} Minuscule, 2/24/2022, 4101.75 (up)
- A{-8} Subminuscule, 2/24/2022, 4101.75 (up)
Learning and other resources. Elliott wave analysis provides context, not prophecy. As the 20th century semanticist Alfred Korzybski put it this way in his book Science and Sanity (1933), “The map is not the territory … The only usefulness of a map depends on similarity of structure between the empirical world and the map.” And I would add, in the ever-changing markets, we can judge that similarity of structure only after the fact.
See the menu page Analytical Methods for a rundown on where to go for information on Elliott wave analysis.
By Tim Bovee, Portland, Oregon, February 25, 2022
Disclaimer
Tim Bovee, Private Trader tracks the analysis and trades of a private trader for his own accounts. Nothing in this blog constitutes a recommendation to buy or sell stocks, options or any other financial instrument. The only purpose of this blog is to provide education and entertainment.
No trader is ever 100 percent successful in his or her trades. Trading in the stock and option markets is risky and uncertain. Each trader must make trading decisions for his or her own account, and take responsibility for the consequences.
License
All content on Tim Bovee, Private Trader by Timothy K. Bovee is licensed under a Creative Commons Attribution-ShareAlike 4.0 International License.
Based on a work at www.timbovee.com.

You must be logged in to post a comment.